
Gold price dropped last week 0.5% to $1,281 as risk on in equities and stronger Dollar brought sellers in the precious metal pushing prices lower. Technically we were expecting breakout to the upside, but we were also prepared for an exit in case the break out was to the downside.
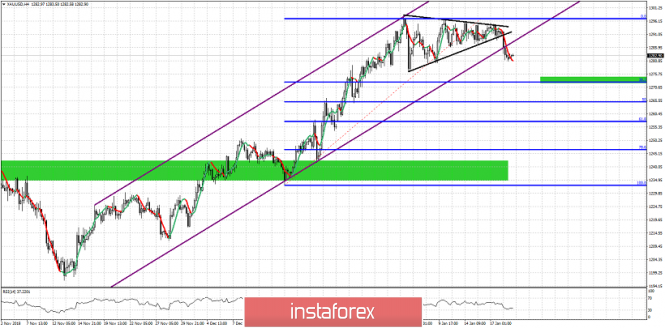
Purple lines - bullish channel
Black lines -triangle pattern
In our previous post we mentioned the price levels that would trigger a break out either to the upside or the downside. Gold price broke to the downside once the $1,290 level failed to hold. We also warned that a break to the downside would push prices towards $1,280 in the beginning and then we would expect price to move towards the 38% Fibonacci retracement level of the upward move from $1,232. So our short-term target and important short-term support level is around $1,272, Resistance is at $1,293 and any break above this level will open the way for $1,320 and higher.
The material has been provided by InstaForex Company - www.instaforex.com