
EUR/USD as expected by our last analysis is pulling back towards 1.15-1.1470 area. I consider this to be a back test of the breakout area and I expect prices to bounce higher towards 1.17 at least from current levels.
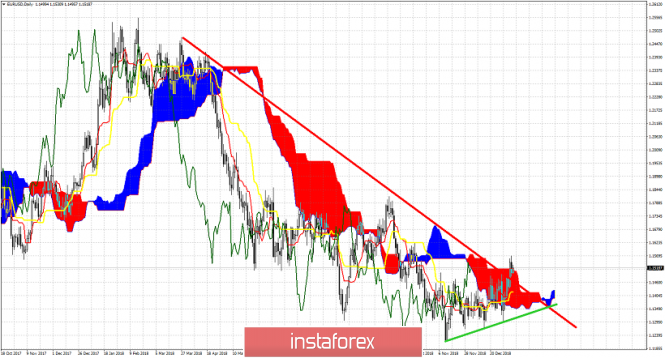
Green line - trend line support
As we saw this week, EUR/USD finally broke out and above its two month trading range and recaptured the 1.15 level. Price has broken above both the downward sloping trend line and the Daily Ichimoku cloud. As long as price is above the cloud we remain bullish medium-term. Support is found at 1.1435 next. Bulls do not want to see this level broken. The ideal scenario for bulls would be to see price break above 1.1570 soon and recapture 1.16. Holding above 1.15 would also be good for bulls as this would mean that there are no selling pressures strong enough to bring price back inside the trading range. On the other hand bears want to see price fall back below 1.1470 and most importantly below 1.1435. Medium-term trend will change to bearish once again if we see price break below the green trend line. Then we will be targeting a move to new lows towards 1.10.
The material has been provided by InstaForex Company - www.instaforex.com