
Technical outlook:
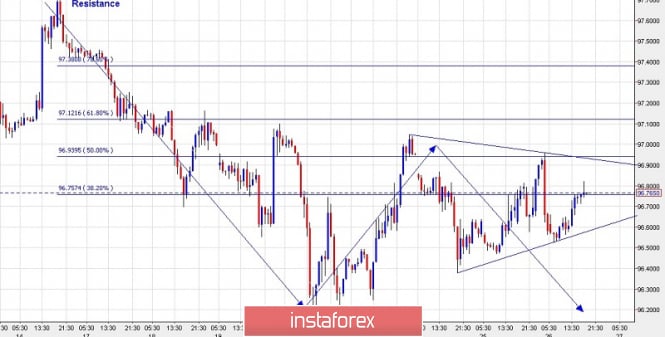
An hourly chart view is presented here for a short-term outlook on the US Dollar Index. Since the last few trading sessions, due to the lack of liquidity, the US Dollar Index has been consolidating in a cone formation as highlighted on the chart. At the moment, the prices are seen to be trading at the 96.77 level, close to the resistance line. It may drop lower towards the support line of consolidation before pushing higher towards the 97.10 level, which is also the Fibonacci 0.618 resistance of the previous drop between the level of 97.71 and 96.20, respectively. If the prices manage to reach the level of 97.10, it should be considered as an opportunity to open short positions at the 97.71 level. Bears are expected to remain in control until the prices stay below the 97.71 level, while going forward.
Trading plan:
Short positions should be opened between the 97.00/10 levels with a stop order above 97.71, and the target of at least 95.00.
Good luck!
The material has been provided by InstaForex Company - www.instaforex.com