
To open long positions on the GBP/USD it is required:
The closer December 11 is, the higher the volatility and uncertainty with the pound. Today's purchases can be seen after a false breakout and return to the support level of 1.2722, which will lead to a larger upward trend in the mid-channel area of 1.278, and then to the update of its upper limit in the area of 1.2823, where I recommend taking profit. In the event of a decrease in the GBP/USD under the level of 1.2722, it is best to consider buying after updating the lows in the area of 1.2663 and 1.2625.
To open short positions on the GBP/USD it is required:
The bears have to rely on a return under the support level of 1.2722, which will open a direct road to the area of the large level 1.2663 and 1.2625, where I recommend taking profits. In the event of growth in the first half of the day, you can return to short positions when a false breakdown is formed around 1.2778 or sell the GBP/USD immediately to rebound from the upper limit of the side channel 1.2823.
Indicator signals:
Moving averages
Trading is conducted in the area of 30-day and 50-day moving averages, which indicates the lateral nature of the market.
Bollinger Bands
Volatility is low, which does not give signals to enter the market.
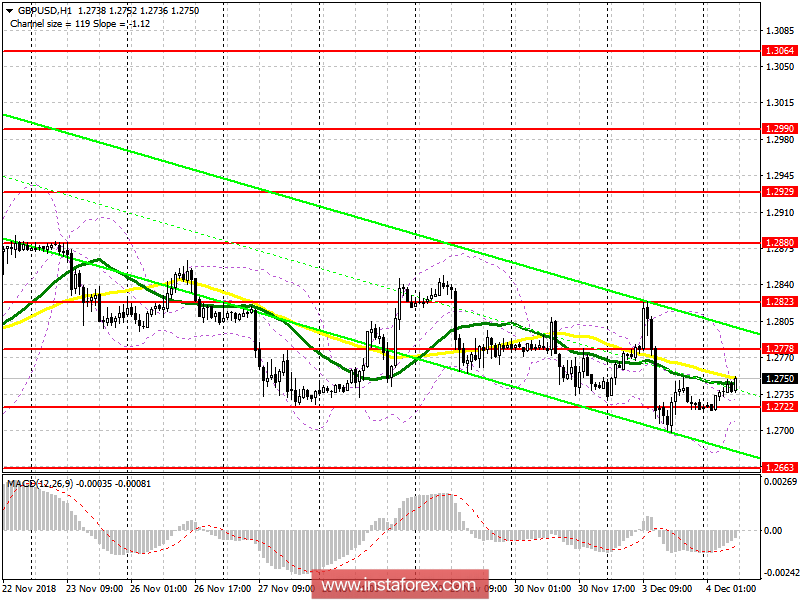
Indicator description
- Moving Average (average sliding) 50 days - yellow
- Moving Average (average sliding) 30 days - green
- MACD: fast EMA 12, slow EMA 26, SMA 9
- Bollinger Bands 20