
Gold price continues to trade near its recent highs and below major resistance at $1,243.50. Short-term trend remains bullish but I prefer to be neutral or bearish at current or higher levels as long as we trade below $1,243.50. There are some warning signs for bulls that should not be ignored.
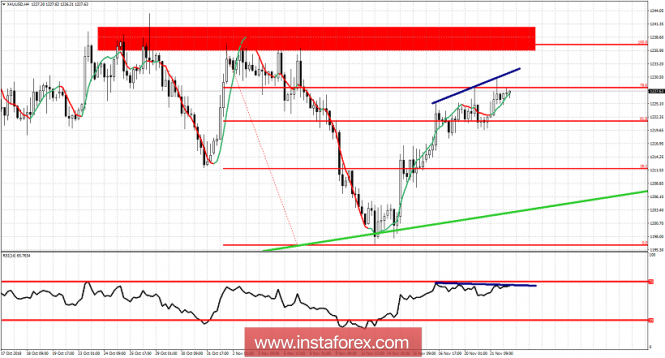
Blue lines - bearish divergence
Green line -major support trend line
Gold price has resistance at $1,232 but the major trend change level is at $1,243.50. The October highs. Support is at $1,219.70 and if broken I will be expecting a new strong downward move that will push price towards the green upward sloping trend line support. In the short-term the chances of a new higher high towards $1,232 are high. But be aware of the bearish RSI divergence. If we see a new high and the divergence persists, I will prefer the short side of the market with stops placed at $1,243.50. Otherwise, any sign of weakness with price breaking below $1,220 would make me bearish again with stops at recent highs.
The material has been provided by InstaForex Company - www.instaforex.com