
Gold price challenged resistance at $1,236 yesterday, it got rejected and pulled back towards the 61.8% Fibonacci retracement support. In our last analysis, I mentioned that as long as price is below $1,240, the chances of another pull back towards the 61.8% Fibonacci retracement remain high. Only a close and break above $1,240 would cancel any chances for another pull back.
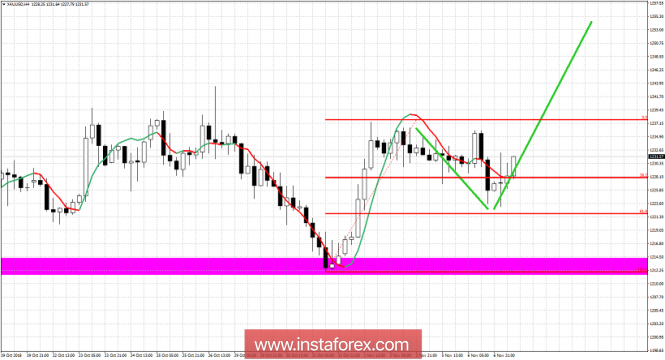
Magenta rectangle - major support area
Green lines - expected path
Gold price initially held support at the 38% Fibonacci retracement level. Bounced but got rejected at the resistance of $1,235-39 and pulled back towards the 61.8% Fibonacci level. Prices are bouncing off this support level and this is a bullish sign. For bulls to remain under control of the trend and for prices to move towards our target of $1,260-70 we should soon see a break above $1,235-40. As long as we do not break above this level, bears are fighting back hard. Support is at $1,223-21. Breaking and closing below this level is something bulls do not want to see. This would put the major support at $1,212 in danger and the entire bullish scenario as well.
The material has been provided by InstaForex Company - www.instaforex.com