
To open long positions on GBP / USD, you need:
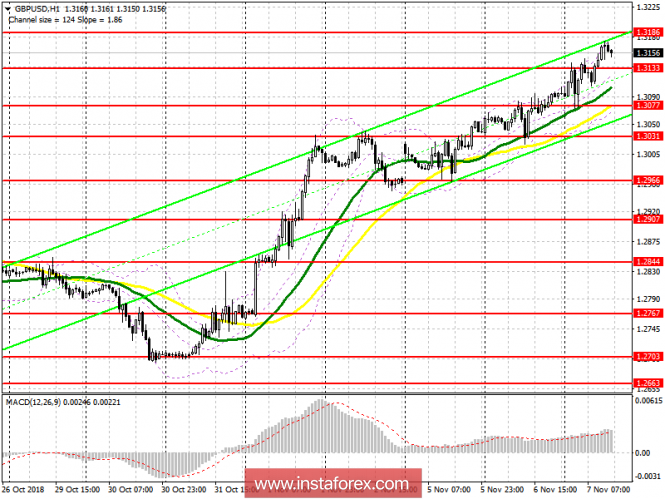
Buyers continue to push the pound up. The breakthrough of the level of 1.3133 and consolidation above allows us to count on the continuation of the upward trend with the update of the maximum near 1.3186 and 1.3233, where I recommend fixing the profit. In the case of a decrease in the pound in the afternoon, the formation of a false breakdown in the support area of 1.3133 will also be a signal to buy. Otherwise, it is best to open long positions to rebound from 1.3077.
To open short positions on GBP / USD, you need:
Only an unsuccessful consolidation and return below the resistance level of 1.3186 can lead to the formation of a downward correction in the GBP / USD pair, otherwise short positions can be opened for a rebound from the maximum of 1.3233. The main task of the sellers in the afternoon will be the return and consolidation under the support of 1.3133, which will lead to a larger decline of the pound to the minimum area of 1.3077 and stop the uptrend.
Indicator signals:
Moving Averages
Trade is conducted above the 30- and 50-day average, which maintains the upward potential in the British pound.
Bollinger bands
The break of the middle border of the Bollinger Bands indicator near 1.3130 will lead to a downward correction of GBP / USD.
Description of indicators
- MA (moving average) 50 days - yellow
- MA (moving average) 30 days - green
- MACD: fast EMA 12, slow EMA 26, SMA 9
- Bollinger Bands 20