
Gold price pulled back below $1,220 but prices moved back up again towards $1,230. Gold price is in a short-term consolidation phase. We cannot rule out a move lower towards $1,210 as long as price is below $1,233.
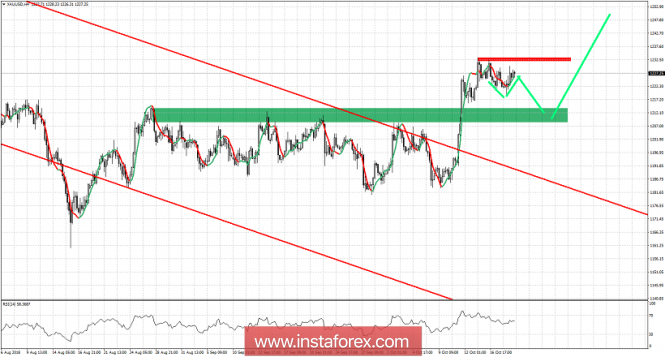
Red lines - long-term bearish channel
Green rectangle - support area
Red rectangle - resistance area
Green lines - expected price path
Gold price is consolidating above the break out area of $1,207-12. Price has given us a bullish signal and the first target of $1,220 has been achieved. Now we expect prices to move sideways or lower towards $1,210 for a back test of the break out area. Resistance is at $1,232-33. Breaking above this level will decrease dramatically any chances for a pull back towards $1,210. Next target is at $1,250-60.
The material has been provided by InstaForex Company - www.instaforex.com