
To open long positions on GBP / USD, you need:
It is best to return to long positions in the pound by updating the next monthly lows. The formation of a false breakdown in the support area of 1.12872, with the confirmation of divergence on the MACD indicator, will be the first signal to buy GBP / USD. Otherwise, it is best to open long positions after updating the areas of 1.2831 and 1.2790. The task of buyers for the first half of the day will be the return and consolidation above the resistance level of 1.2911, which will lead to an increase in the pair to the upper boundary of the downward channel and to an update of the maximum of 1.2947, where I recommend fixing the profits.
To open short positions on GBP / USD, you need:
The formation of a false breakdown in the first resistance area of 1.2911 will be a signal to open short positions in the pound in order to repeat the test and breakdown support of 1.2872, which will lead to a new downward wave with the update of the minimums of 1.2831 and 1.2790, where I recommend fixing the profits. In the case of growth above 1.2911 in the first half of the day, you can count on short positions after updating the larger resistance at 1.2947, where the upper limit of the downward price channel is also located.
Indicator signals:
Moving Averages
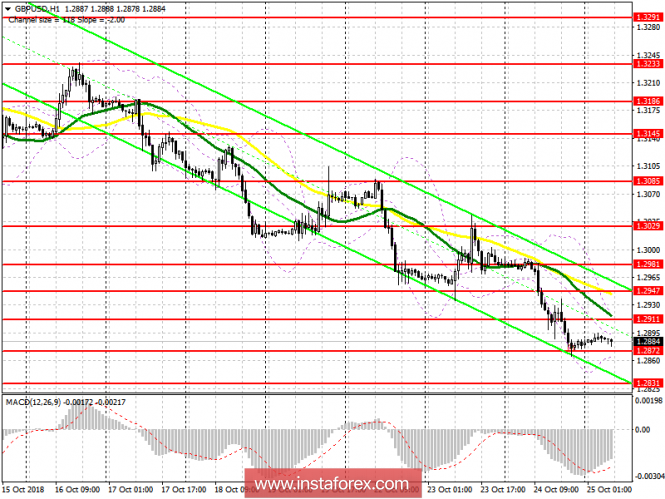
Trade is conducted under the 30- and 50-day average, which indicates the bearish nature of the market.
Bollinger bands
The upper border of the Bollinger Bands indicator around 1.2915 limits the upward potential, and the breakdown of the lower border around 1.2872 will be a direct signal to sell the pound.
Description of indicators
- MA (moving average) 50 days - yellow
- MA (moving average) 30 days - green
- MACD: fast EMA 12, slow EMA 26, SMA 9
- Bollinger Bands 20