
To open long positions for EURUSD, it is required:
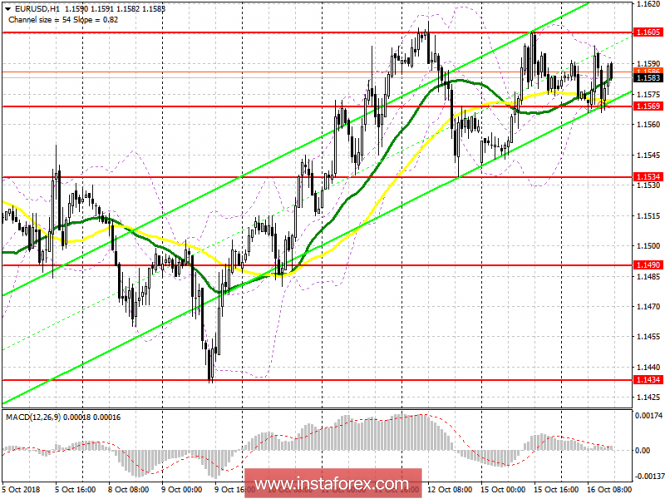
The market situation has not changed compared to the morning forecast. Trading remains in the side channel of 1.1534-1.1605. The formation of a false breakout in the support area of 1.1569 occurred, which led to the resumption of demand for the euro, but the main task is to re-test and break the upper limit of 1.1655 with the exit to the highs in the area of 1.1648 and 1.1682, where I recommend to lock in the profit. If the euro falls below the support level of 1.1569 in the second half of the day, purchases can be returned to the rebound from the lower border of 1.1534.
To open short positions for EURUSD, it is required:
Sellers will expect an unsuccessful consolidation above the resistance of 1.1605, and good data on industrial production in the US will lead to a decline in the EUR/USD in the support area of 1.1569, where I recommend taking profits. If a quick sell-off after the update of last week's high does not follow, I recommend returning to short positions in euro only to rebound from the resistance level of 1.1648. A break of support at 1.1570 will instantly lead to a decline in the euro to yesterday's low of 1.1537.
Indicator signals:
Moving averages
Trade has moved one level from the 30- and 50-day moving average, which indicates the lateral nature of the market.
Bollinger bands
The volatility of the Bollinger Bands indicator is very low, and therefore I do not recommend paying attention to its performance.
Indicator description
Moving Average (average sliding) 50 days - yellow
Moving Average (average sliding) 30 days - green
MACD: fast EMA 12, slow EMA 26, SMA
Bollinger Bands 20
The material has been provided by InstaForex Company - www.instaforex.com