
To open long positions on EUR/USD pair, you need:
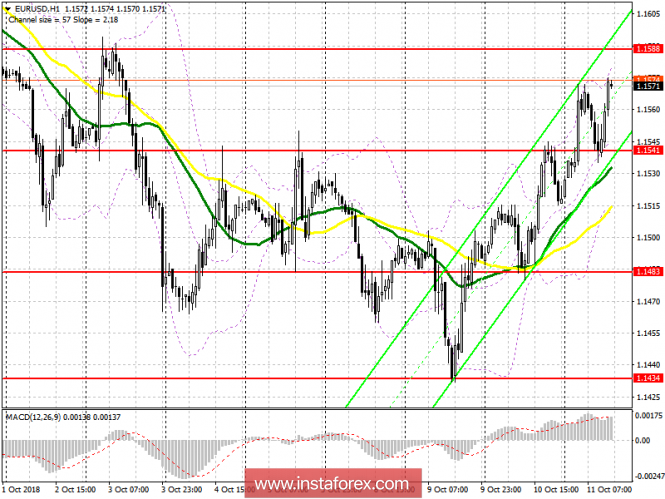
Buyers managed to form a false breakdown at the level of 1.1541 considering yesterday events, which I paid attention to in my morning review and in turn, kept the upward potential in euros. The main task for the second half of the day will be updating of resistance 1.1588 and fixing on it that will lead to a larger upward impulse for the euro with a test of highs 1.1636 and 1.1683, where taking profits are recommended. In the case of a decline below the support level of 1.1541, long positions can only return to rebound from the 1.1483 level after the publication of the minutes from the last meeting of the European Central Bank.
To open short positions on EUR/USD pair, you need:
It is best to rely on short positions in the euro come afternoon after the update of resistance 1.1588 with the formation of a false breakdown there. The main task remains the reduction and consolidation below the support level of 1.1541, which will be a clear signal to open new short positions in the euro with an update of the minimum level at 1.1483, where taking profits are recommended. In case of growth above 1.1588, you can sell the EUR / USD pair immediately to rebound from a maximum of 1.1636.
Indicator signals:
Moving averages
The price is above the 30 and 50 average, indicating a continuation of the upward trend.
Bollinger bands
The upside potential is limited by the upper line of the Bollinger Bands indicator. Its breakthrough will lead to a new wave of growth in the euro.
Description of indicators
- MA (moving average) 50 days - yellow
- MA (moving average) 30 days - green
- MACD: fast EMA 12, slow EMA 26, SMA 9
- Bollinger Bands 20