
Gold price has broken below short-term support of $1,200. Price is challenging last week's lows and it looks like they are going to be broken as well with Gold price heading towards $1,180. Gold bulls should step in around $1,180 otherwise we are in danger of continuing lower towards $1,140.
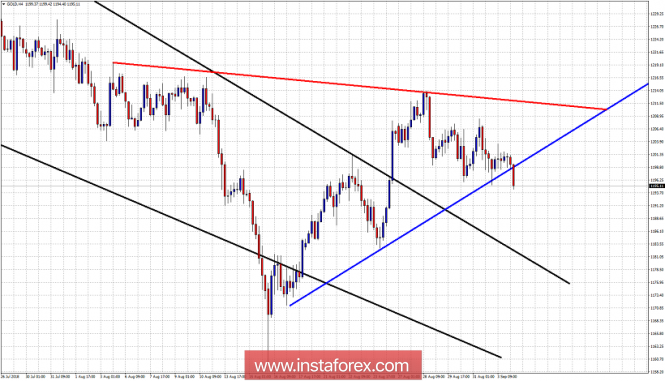
Blue line - broken support trend line
Red line - resistance
Gold price is now below the short-term support trend line. Gold price is going to back test the upper wedge boundary around $1,180. That level could be a nice risk reward bullish opportunity. For now trend is again bearish in the short-term as long as price is below $1,210. Inability to hold above $1,200 is bearish. Resistance at $1,210 remains. We now look for a continued move lower before higher to $1,220-30. Bears will regain full control of the trend on a weekly close below $1,180.
The material has been provided by InstaForex Company - www.instaforex.com