
To open long positions for EUR / USD pair, you need:
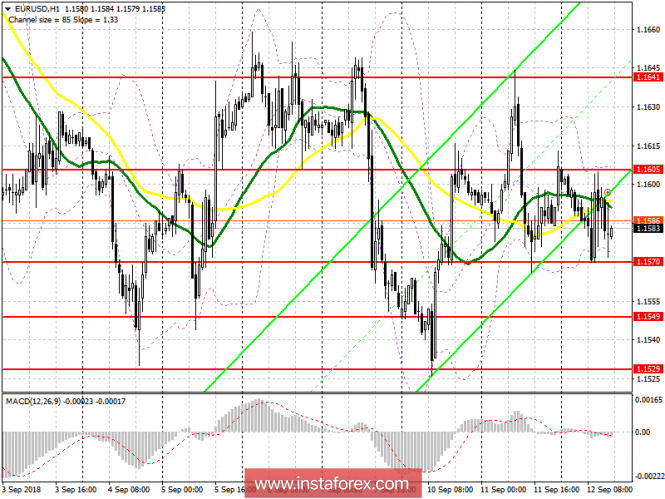
In the first half of the day on Wednesday, buyers did not have enough strength to get above the resistance of 1.1605, which I paid attention to in my morning review. A breakthrough of level 1.1605 is necessary to maintain the upward trend, which was formed earlier this week that could lead to a repeat test of highs around 1.1641 and their update in the area of 1.1686, where fixing profits are recommended. If the euro falls below the support level of 1.1570 in the second half of the day, it is best to return to long positions on the rebound from the area of 1.1553.
To open short positions for EUR / USD pair, you need:
Bears kept the pair below the resistance level of 1.1605, and now all the calculation for good data on producer prices in the US, which can support the US dollar and will resume pressure on the euro pair. The breakthrough of support 1.1570 will be a signal for the opening of short positions in order to decrease and return to the lows of week 1.1549 and 1.1529, where fixing profits are recommended. In the case of weak data on the US economy, I recommend that I return to sales after the next renewal of resistance 1.1605 or to a rebound from 1.1641.
Indicator signals:
The 30-day moving average is on par with the 50-day moving average. This indicates that the trade will be conducted in the side channel.
Description of indicators
- MA (average sliding) 50 days - yellow
- MA (average sliding) 30 days - green
- MACD: fast EMA 12, slow EMA 26, SMA 9
- Bollinger Bands 20