
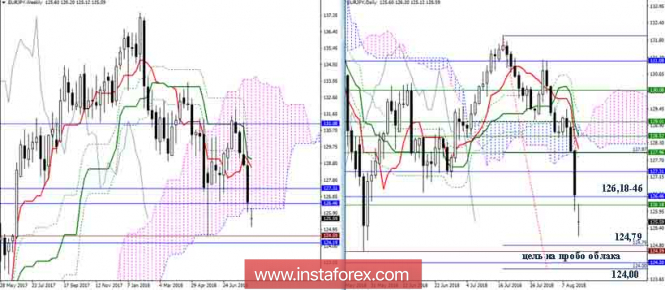
EUR / JPY
The players on the fall could not close the past week below the support levels of 126.18-46 (monthly Senkou Span A + week Senkou Span B). Today, they went on the trick and still turned support into resistance by doing it with the help of a good descending gap, executed at the opening of the market. The fastening on the current positions will allow to continue the decline, the nearest reference point of which now serves the area of 124.00-79 (day target for breakdown of clouds + monthly Kijun + minimum extremum).
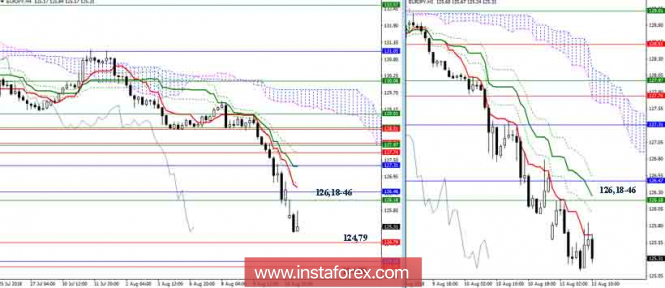
At lower time intervals, the downtrend now enjoys the support of all elements of the Ichimoku indicator. The benchmarks are the levels of the senior periods, led by the daily target of 124.00-79. The most important resistance, in the case of development of correction, today, is the area of 126.18-46. Here, the levels of various times are concentrated, fixing above will change the current balance of forces and will allow to consider the possibilities for forming a full-scale upward correction.
Indicator parameters:
All time intervals 9 - 26 - 52
The color of indicator lines:
Tenkan (short-term trend) - red,
Kijun (medium-term trend) - green,
Fibo Kijun is a green dotted line,
Chinkou is gray,
Clouds: Senkou Span B (SSB, long-term trend) - blue,
Senkou Span A (SSA) - pink.
The color of additional lines:
Support and resistance MN - blue, W1 - green, D1 - red, H4 - pink, H1 - gray,
Horizontal levels (not Ichimoku) - brown,
Trend lines - purple.
The material has been provided by InstaForex Company - www.instaforex.com