
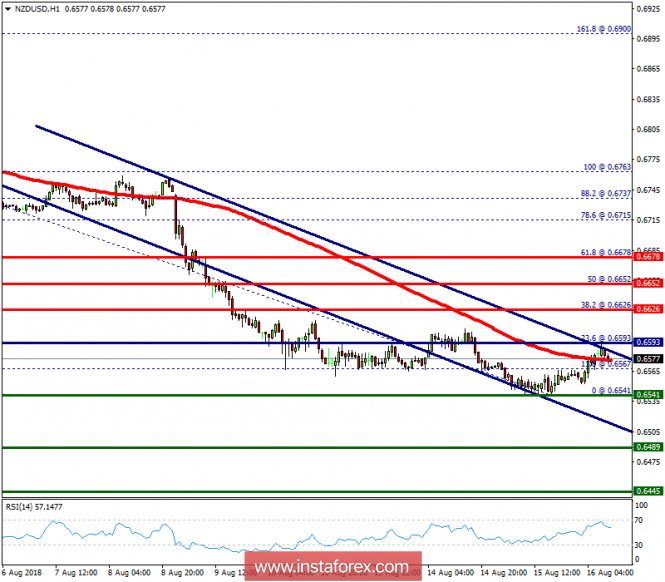
The NZD/USD pair dropped from the level of 0.6593 towards 0.6541. Now, the price is set at 0.6583. On the H4 chart, the resistance of NZD/USD pair is seen at the level of 0.6626 and 0.6652.
It should be noted that volatility is very high for that the NZD/USD pair is still moving between 0.6593 and 0.6541 in coming hours.
Moreover, the price spot of 0.6593/0.6626 remains a significant resistance zone. Therefore, there is a possibility that the NZD/USD pair will move downside and the structure of a fall does not look corrective. In order to indicate the bearish opportunity below 0.6593/0.6626, sell below 0.6593 or 0.6626 with the first target at 0.6541 in order to test yesterday's bottom. Also, it should be noticed that support 1 is seen at the level of 0.6593 which coincides the daily pivot point.
Additionally, if the NZD/USD pair is able to break out the bottom at 0.6541, the market will decline further to in order to test the daily support 2 (0.6489).
The material has been provided by InstaForex Company - www.instaforex.com