
Gold price is pulling back towards $1,200 for a back test of the break out. Price has also broken above the long-term wedge pattern and has started making higher highs and higher lows in short time frames. This could be the start of a bigger bounce towards $1,220-$1,250 as long as we hold above $1,180.
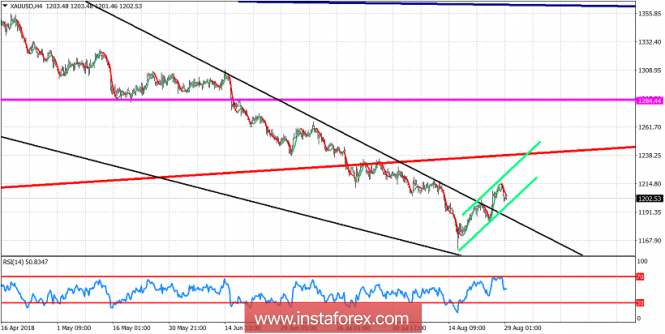
Green lines - bullish short-term channel
Gold price is rising inside a short-term bullish channel. Short-term support is first at $1,200 and next at $1,190. We could see $1,190 as a back test of the broken wedge pattern, however this is not necessary. Resistance is at $1,205 and next at $1,214 yesterday's highs. A break above this level will open the way for a move towards $1,220-30 at least. I'm bullish as long as we trade above $1,180.
The material has been provided by InstaForex Company - www.instaforex.com