MG Network

something big isHappening!

In the mean time you can connect with us with via:

Copyright © Money Grows Network | Theme By Gooyaabi Templates

Money Grows Network

Archive

Powered by Blogger.

Welcome To Money Grows Network

Verified By

2006 - 2019 © www.moneygrows.net

Investments in financial products are subject to market risk. Some financial products, such as currency exchange, are highly speculative and any investment should only be done with risk capital. Prices rise and fall and past performance is no assurance of future performance. This website is an information site only.

Popular

Pages

Expert In

Name*


Message*

Technical analysis of Gold for August 1, 2018

The Gold price remains inside the downward sloping wedge pattern. The price is testing the resistance area at $1,225-26. A sustained break above this area and a continued move higher above $1,235 could be the first sign of a bigger reversal.

analytics5b60c992e3fb1.png

Black lines - wedge pattern

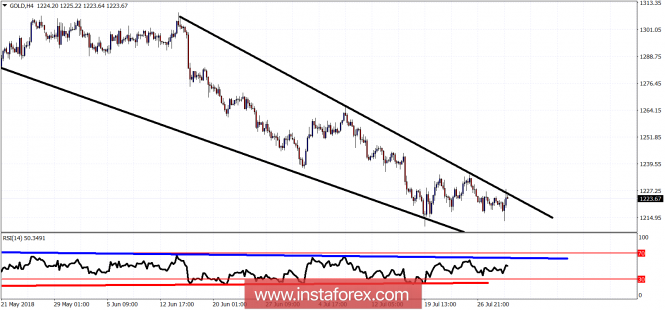
Blue line - RSI resistance

Red line - RSI Support

The Gold price has short-term resistance at $1,225-26. Next and most crucial is at $1,236. Support is at $1,214 and next at $1,200. Break above resistance and we could see $1,300 in the first two weeks of August.

The material has been provided by InstaForex Company - www.instaforex.com