Last week, the global investors got the latest retail sales data from the United States. According to information provided by the American Census Bureau, the value of the basic retail sales increased in July this year by 0.6%, which turned out to be a much better result than the previous publication (0.2%) as well as from already optimistic forecasts (0.4%). The full retail sales index was also well presented, which despite the forecasts assuming maintaining the growth rate at 0.2%, eventually increased by as much as 0.5%.
The American Census Burau published data from the real estate market regarding, among others building permits and started construction of houses. The July value of building permits amounted to 1.311 million, beating forecasts of analysts (1.310 million) and June results (1.292 million). Thanks to this, the dynamics of the indicator on a monthly basis recorded a strong reflection of 1.5% (from -0.7% observed in the previous period). The result of housing starts (started house construction) was not so optimistic. Although the reading at 1.168 million was better than the previous one, which was revised down to 1.158 million from 1173 million, it did not meet the expectations of analysts who assumed a reading at 1.270 million. This fact caused that the indicator dynamics was at the level of 0.9% which is a result of significantly worse than expected (7.4%), although still better than the previous reading, which was revised to -12.9% from -12.3% %.
As every Thursday, at the same time, the global investors also got to know the data from the American labor market. According to the latest Department of Labor report, the number of pre-declared unemployed in the week ending on July 11 this year. it was at the level of 212,000, which means a decrease of 2,000 compared to last week.
The markets also got familiar with the preliminary reading of the University of Michigan index for August this year. The index itself is based on telephone surveys that are conducted on a representative group of 500 US households. They ask for both an assessment of the current economic conditions and expectations as to the future. The consensus before this publication assumed a slight increase in the index value to 98.1 from 97.9 previously. However, as it turned out, the purchasing power of American consumers seems to be significantly worse now, as the result at the level of 95.3 turned out to be much worse than just the forecasts, but also the previous publication.
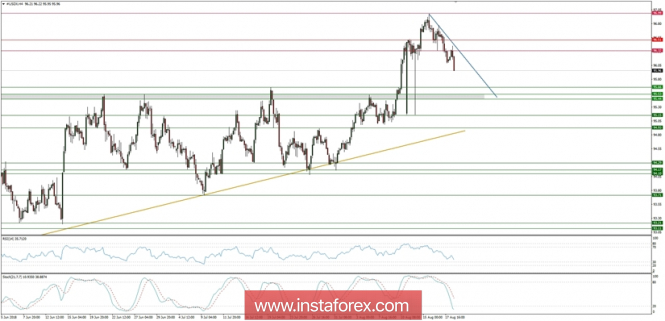
In conclusion, the data from the US economy was not that good as expected, which might trigger the weakening of the US Dollar across the board. Let's then take a look at the US Dollar Index technical picture at the H4 time frame. The market has made a top at the level of 97.00 and since then the price is falling towards the level of 95.66, which is the important technical support for the market. The momentum indicator is pointing down and it is below the fifty level, so it is another confirmation of a short-term bearish bias.