
In April, the EUR/AUD pair expressed a significant bearish movement that extended between the price level of 1.6110 down to 1.5280.
Since June 6, the pair has been trending-up above the depicted uptrend on the H4 chart. This depicted bullish movement was initiated around 1.5280.
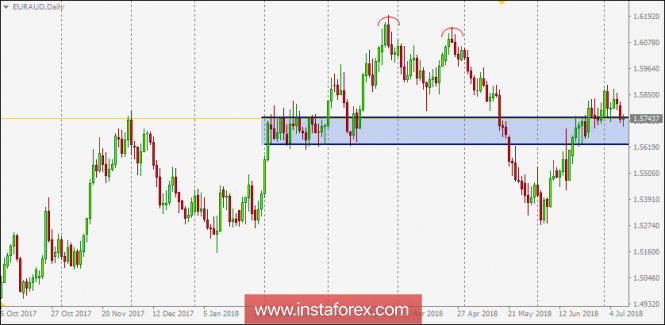
Recently, the evident bearish pressure was initiated around 1.5880. This led to a bearish breakdown of the depicted uptrend allowing the current bearish decline to occur towards 1.5710.
Please note that the price zone 1.5750-1.5650 constitutes a prominent demand zone corresponding to a previous consolidation range that goes back to February 2018.
Daily candlestick closure below 1.5750 (38.2% Fibonacci level) enhances further bearish decline towards 1.5650-1.5580 (near 50% Fibonacci level) where bullish rejection and a valid BUY entry should be anticipated.
On the other hand, re-consolidation above 1.5750 enhances further bullish momentum initially towards the recent highs around 1.5800.
The material has been provided by InstaForex Company - www.instaforex.com