
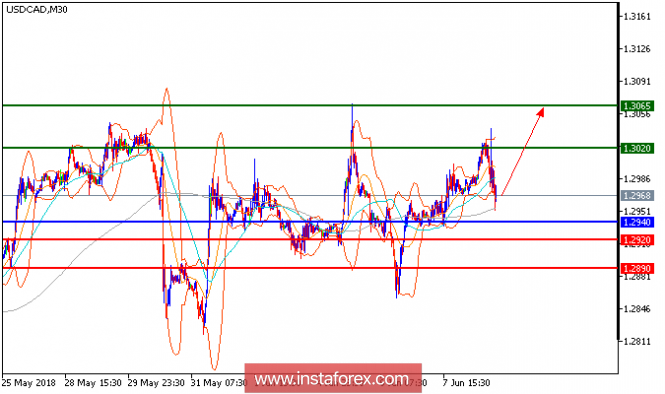
USD/CAD is expected to trade with a bullish outlook. Despite the recent pullback from 1.3030, the pair is still trading above its rising 50-period moving average. The relative strength index lacks downward momentum. To conclude, as long as 1.2940 is not broken, look for a rebound to 1.3020. A break above this level would trigger a new upleg to 1.3065 in extension.
Fundamental Overview: Today's data shows that Canada unexpectedly shed jobs in May, while the unemployment rate remained unchanged at a decade-plus low and hourly wages surged at their fastest pace in over nine years. Employment in Canada fell slightly in May, down a net 7,500 jobs on a seasonally adjusted basis.This is the second straight month of job losses, after employment declined by a net 1,100 positions in the previous month. Market expectations were set at a 23,500 advance in employment in May, according to economists at Royal Bank of Canada. The unemployment rate held steady at 5.8%, or the lowest level since October 2007. When using U.S. Labor Department methodology, Canada's jobless rate in May was 4.8%.
Chart Explanation: The black line shows the pivot point. Currently, the price is above the pivot point which is a signal for long positions. If it remains below the pivot point, it will indicate short positions. The red lines show the support levels, while the green line indicates the resistance levels. These levels can be used to enter and exit trades.
Resistance levels: 1.3020, 1.3065, 1.3095
Support levels: 1.2940, 1.2920, 1.2890
The material has been provided by InstaForex Company - www.instaforex.com