
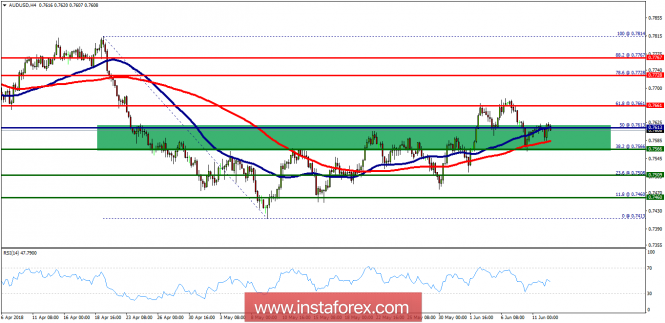
The price is still trading between the levels of 0.7566 and 0.7613. The bullish trend of the AUD/USD pair runs from the support levels of 0.7509 and 0.7566. Currently, the price is in a bullish channel. This is confirmed by the RSI indicator signaling that we are still in a bullish trending market. As the price is still above the moving average (100), immediate support is seen at 0.7566, which coincides with the golden ratio (38.2% of Fibonacci). Consequently, the first support is set at the level of 0.7566. So, the market is likely to show signs of a bullish trend around the spot of 0.7566. In other words, buy orders are recommended above the level of 0.7566 with the first target at the level of 0.7661. Furthermore, if the trend is able to break out through the first resistance level of 0.7661, we should see the pair climbing towards the double top (0.7814) to test it. It would also be wise to consider where to place a stop loss; this should be set below the second support of 0.7460.
The material has been provided by InstaForex Company - www.instaforex.com