
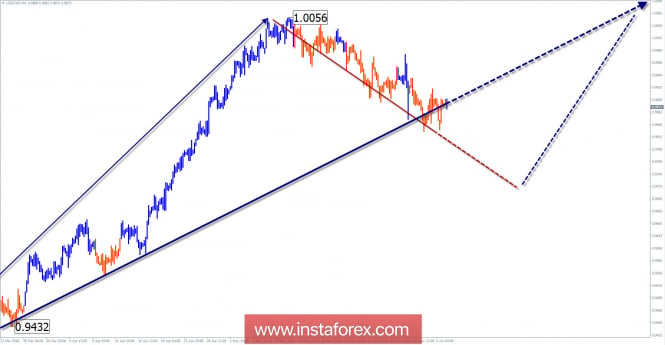
Wave picture of the H4 chart:
On the scale of the major franc pair, the current upward wave started on February 16 has a high potential to move. The formation of the middle part (B) began in the structure of the wave.
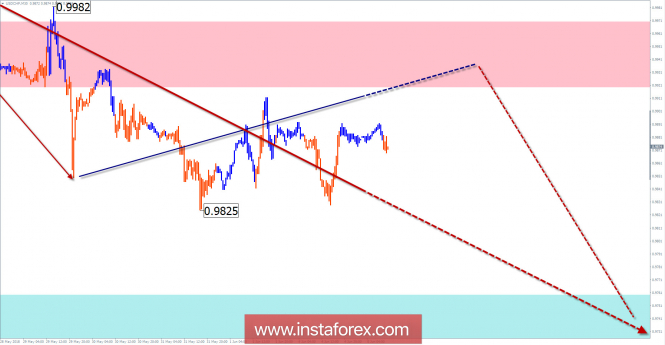
The wave pattern of the H1 graph:
The bearish wave of May 10th has a fleeting character of motion in a more massive construction taking the place of correction. The wave is not yet completed. The preliminary level of its completion is within the limits of settlement in the support.
The wave pattern of the M15 chart:
Within the framework of the main trend since May 29, the price forms an incorrect kind of corrective pullback upwards. The growth potential is limited by the zone of resistance.
Recommended trading strategy:
For trading on large sections of the schedule, you need to wait for the completion of the bearish correction. For smaller scales, short-term sales are possible.
Resistance zones:
- 0.9920 / 0.9970
Support zones:
- 0.9760 / 0.9710
Explanations to the figures:
A simplified wave analysis uses a simple waveform, in the form of a 3-part zigzag (ABC). The last incomplete wave for every timeframe is analyzed. Zones show the calculated areas with the greatest probability of a turn.
Arrows indicate the counting of wave according to the technique used by the author. The solid background shows the generated structure and the dotted exhibits the expected wave motion.
Attention: The wave algorithm does not take into account the duration of the tool movements in time. To conduct a trade transaction, you need to confirm the signals used by your trading systems.
The material has been provided by InstaForex Company - www.instaforex.com