
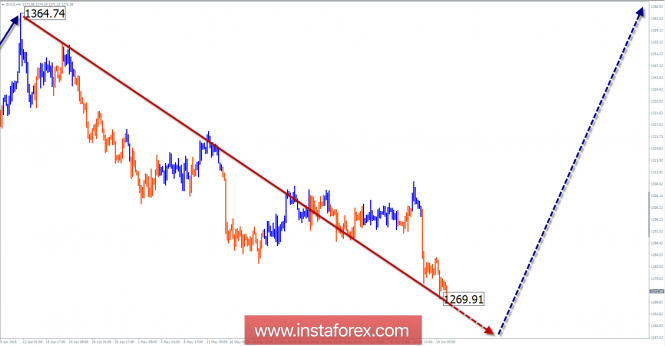
The wave pattern of the H4 graph:
The movement of the price of gold from January 25 sets a bearish wave. In the wave structure, a zigzag (A-B-C) is tracked. The preliminary purpose of the movement is in the area of 1250 USD/XAU ounce.
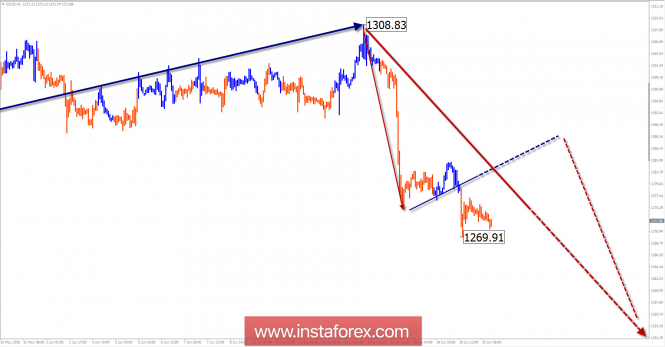
The wave pattern of the H1 graph:
The wave is descending, it starts counting from April 11. The nature of the motion is close to the momentum. After the flat correction a week ago, the next stage of decline began.
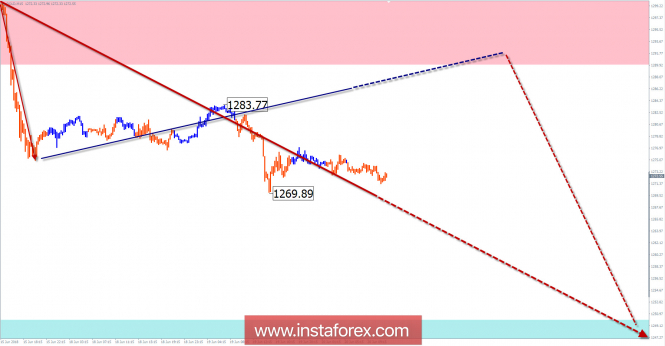
The wave pattern of the M15 chart:
Since June 14, a new bearish wave has started. In the next few days one can wait for the counter phase of the movement (B) to be worked out.
Recommended trading strategy:
In the next weeks, the most reasonable strategy will be the sale of gold. Conditions for buying this tool have not yet begun.
Resistance zones:
- 1290.0 / 1300.0
Support zones:
- 1250.0 / 1240.0
Explanations to the figures:
A simplified wave analysis uses a simple waveform, in the form of a 3-part zigzag (ABC). The last incomplete wave for every timeframe is analyzed. Zones show the calculated areas with the greatest probability of a turn.
Arrows indicate the counting of wave according to the technique used by the author. The solid background shows the generated structure and the dotted exhibits the expected wave motion.
Attention: The wave algorithm does not take into account the duration of the tool movements in time. To conduct a trade transaction, you need to confirm the signals used by your trading systems.
The material has been provided by InstaForex Company - www.instaforex.com