
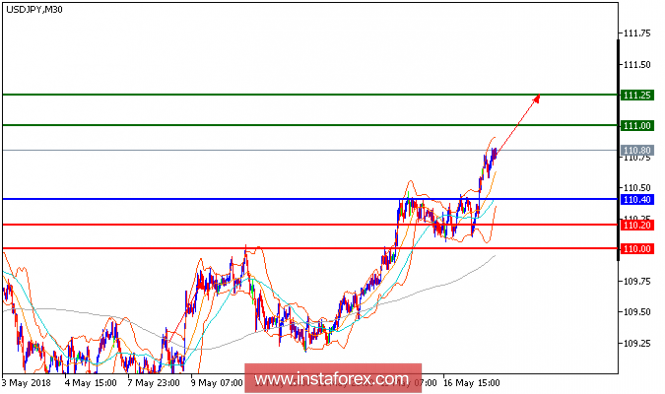
All our upside targets which we predicted in previous analysis have been hit. The pair is still trading in a higher range and expected to continue the upside movement. USD/JPY is proceeding toward the overhead resistance at 111.00 while being supported by the ascending 20-period moving average, which has just crossed above the 50-period one. The level of 110.40 has proven a strong downside support. The intraday configuration remains bullish, and the pair should target 111.25 upon reaching 111.25.
Chart Explanation: The black line shows the pivot point. The present price above the pivot point indicates a bullish position, and the price below the pivot point indicates a short position. The red lines show the support levels, and the green line indicates the resistance levels. These levels can be used to enter and exit trades.
Strategy: BUY, stop loss at 110.40, take profit at 111.00.
Resistance levels: 111, 111.25, and 111.50
Support levels: 110.20, 110.00, and 109.60.
The material has been provided by InstaForex Company - www.instaforex.com