
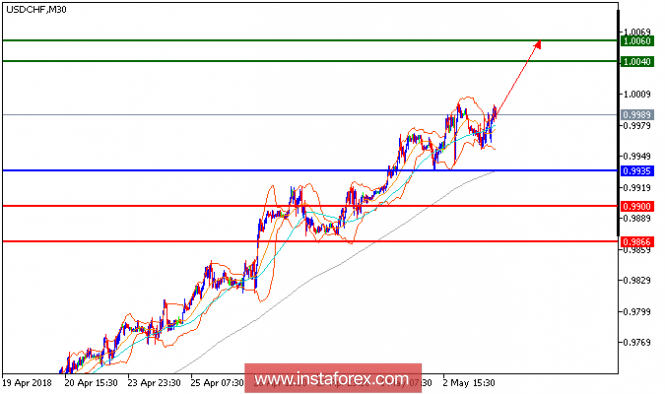
Our first upside target which we predicted in previous analysis has been hit. The pair is heading upward now, and is challenging its key psychological level at 1.0000. An upside breakout of this threshold seems more likely to occur, as the ascending 50-period moving average acts well as a support role, and should push the prices higher. Additionally, the relative strength index is still bullish above its neutrality area at 50. To conclude, as long as 0.9935 is not broken, look for a new rise to 1.0040 and 1.0060 in extension.
Chart Explanation: The black line shows the pivot point. The present price above the pivot point indicates a bullish position, and the price below the pivot point indicates a short position. The red lines show the support levels, and the green line indicates the resistance levels. These levels can be used to enter and exit trades.
Strategy: BUY, stop loss at 0.9935, take profit at 1.0040.
Resistance levels: 1.040, 1.0060, and 1.0080
Support levels: 0.9900, 0.9865, and 0.9830.
The material has been provided by InstaForex Company - www.instaforex.com