
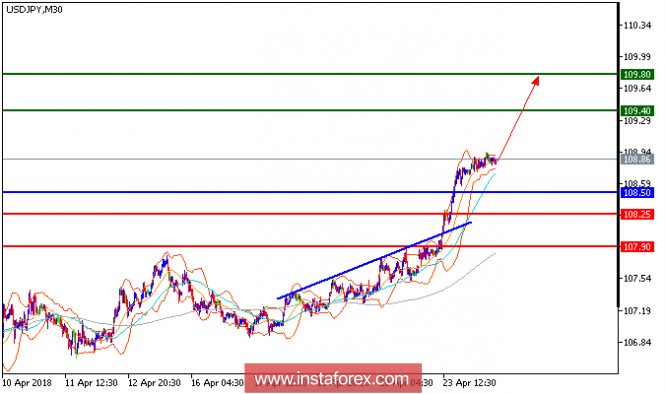
All our upside target which we predicted in the previous analysis have been hit. USD/JPY is still expected to trade with bullish outlook. The pair accelerated on the upside after breaking above the upper boundary of the rising channel. Both rising 20-period and 50-period moving averages play support roles. The relative strength index shows upward momentum. Hence, as long as 108.50 is not broken, look for a further advance with targets at 109.40 and 109.80 in extension.
Chart Explanation: The black line shows the pivot point. The present price above the pivot point indicates a bullish position, and the price below the pivot point indicates a short position. The red lines show the support levels, and the green line indicates the resistance levels. These levels can be used to enter and exit trades.
Strategy: BUY, stop loss at 108.50, take profit at 109.40.
Resistance levels: 109.40, 109.80, and 110.15
Support levels: 108.25, 107.90, and 107.50.
The material has been provided by InstaForex Company - www.instaforex.com