
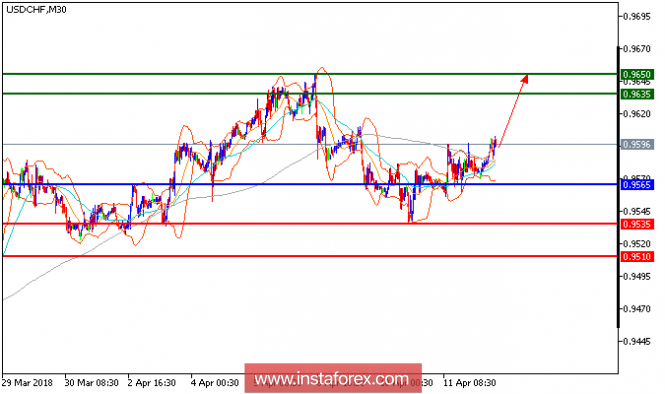
USD/CHF is expected to trade with a bullish outlook. The pair is bouncing off its nearest support at 0.9565 and seems likely to challenge the next resistance at 0.9635 in sight. A bullish cross has been identified between the 20-period and 50-period moving averages. In addition, the relative strength index lacks downward momentum. Therefore, as long as 0.9565 is not broken, look for further advance to 0.9635 and 0.9650 in extension.
Chart Explanation: The black line shows the pivot point. The present price above the pivot point indicates a bullish position, and the price below the pivot point indicates a short position. The red lines show the support levels, and the green line indicates the resistance levels. These levels can be used to enter and exit trades.
Strategy: BUY, stop loss at 0.9565, take profit at 0.9635.
Resistance levels: 0.9635, 0.9650, and 0.9685
Support levels: 0.9535, 0.9510, and 0.9485.
The material has been provided by InstaForex Company - www.instaforex.com