
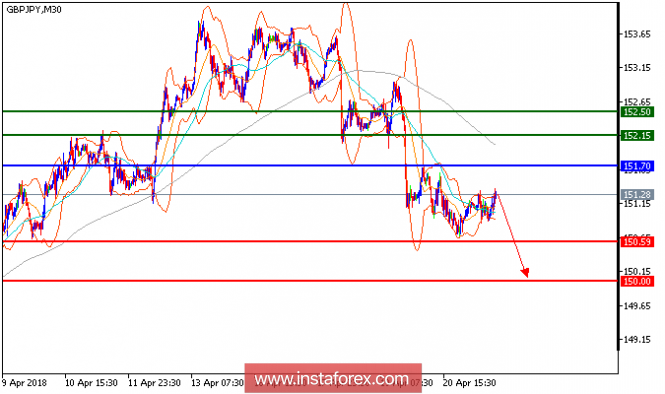
GBP/JPY is expected to trade with a bearish outlook. Despite the recent rebound from 150.60, the pair is still capped by a declining 50-day moving average. The upside potential should be limited by the key resistance at 151.70. Even though a continuation of a technical rebound cannot be ruled out, its extent should be limited. Therefore, as long as 151.70 is not surpassed, look for another drop with targets at 150.60 and 150.00 in extension.
Chart Explanation: The black line shows the pivot point. Currently, the price is above the pivot point which is a signal for long positions. If it remains below the pivot point, it will indicate short positions. The red lines show the support levels, while the green line indicates the resistance levels. These levels can be used to enter and exit trades.
Resistance levels: 152.15, 152.50, and 153.05
Support levels: 150.60, 150.00, and 149.50.
The material has been provided by InstaForex Company - www.instaforex.com