
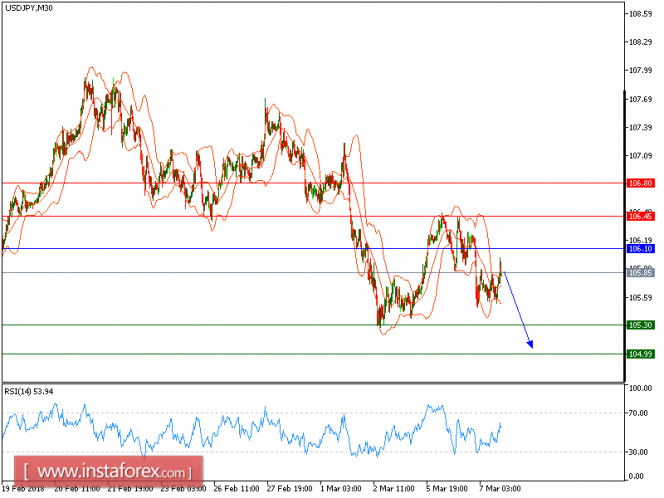
SD/JPY is expected to trade with a bearish outlook. The downward bias prevails. The pair has plunged to the levels below the lower Bollinger band, calling for acceleration to the downside. Strong downward momentum is also proved by the relative strength index, which has breached the oversold level of 30. Intraday bearishness persists and the pair is expected to return to 105.30 on the downside (around a price base seen in March 2-5) before sinking further toward 105.00. Only a break above the key resistance at 106.10 would bring about a bullish reversal.
Alternatively, if the price moves in the opposite direction, a long position is recommended to be above 106.10 with a target of 106.45.
Chart Explanation: The black line shows the pivot point. The current price above the pivot point indicates a bullish position, while the price below the pivot point is a signal for a short position. The red lines show the support levels, and the green line indicates the resistance level. These levels can be used to enter and exit trades.
Strategy: SELL, stop loss at 106.10, take profit at 105.30.
Resistance levels: 106.45, 106.80, and 107.15
Support levels: 105.30, 105.00, and 104.60.
The material has been provided by InstaForex Company - www.instaforex.com