
Gold price pulled back below the Ichimoku cloud yesterday as the US dollar strengthened. The price action remains inside the wider trading range of $1,310-$1,350. The short-term trend has turned bearish again as the price is now again below the cloud support.
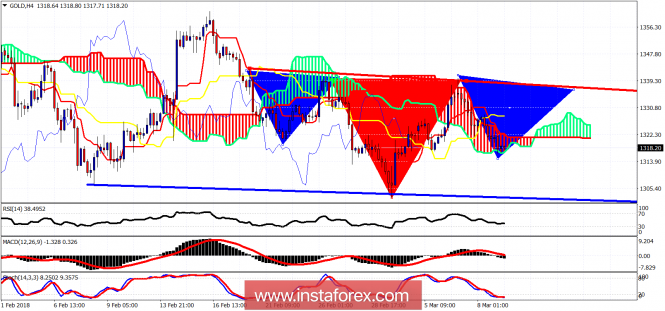
Blue line - trend line support
Red triangle - Head
Blue triangles - shoulders
Gold price is trading below the Ichimoku cloud on the 4-hour chart. However, the price may be forming an inverted head and shoulders pattern. For this pattern to be valid, we need to see the gold price moving higher towards $1,338 and test the neckline. This way the right shoulder will be formed. This is now very important resistance.
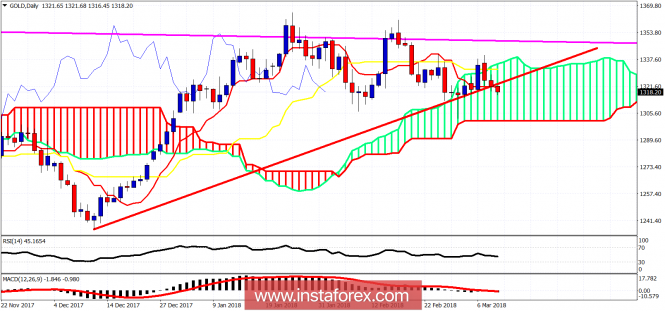
Red line- trend line support
Daily trend remains neutral as the price is inside the Daily Kumo. The price has broken the red trend line support and the tenkan-sen (red line indicator). $1,300 is important cloud support. If broken, we should expect the gold price to go towards $1,280-70. Resistance is at $1,340. Upon a break above it, we will most probably break above the double top resistance.
The material has been provided by InstaForex Company - www.instaforex.com