MG Network

something big isHappening!

In the mean time you can connect with us with via:

Copyright © Money Grows Network | Theme By Gooyaabi Templates

Money Grows Network

Archive

Powered by Blogger.

Welcome To Money Grows Network

Verified By

2006 - 2019 © www.moneygrows.net

Investments in financial products are subject to market risk. Some financial products, such as currency exchange, are highly speculative and any investment should only be done with risk capital. Prices rise and fall and past performance is no assurance of future performance. This website is an information site only.

Popular

Pages

Expert In

Name*


Message*

Ichimoku cloud indicator analysis of gold for March 8, 2018

Gold price is making higher highs and higher lows in the 4-hour chart and is breaking above the Kumo. Trend is turning bullish. Medium-term trend is neutral as price remains inside the Daily Kumo and still inside the $1,350-$1,310 trading range.

analytics5aa0e9c37669f.png

Price is above the 4-hour Kumo. Support is at $1,322-16. Resistance is at $1,340. So far it looks like bulls remain in control as the critical support of $1,300 has been held and price has now started again to make higher highs and higher lows.

analytics5aa0ea45d0c6d.png

Magenta line -long-term resistance

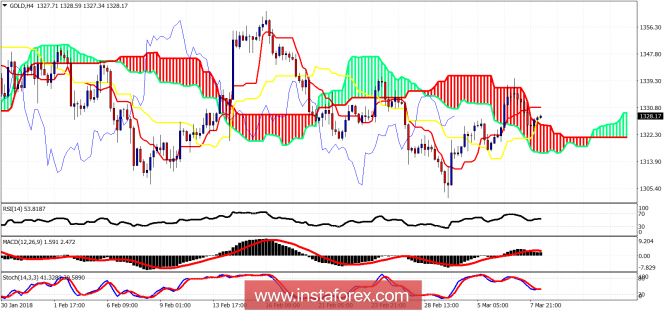
Red line - short-term support

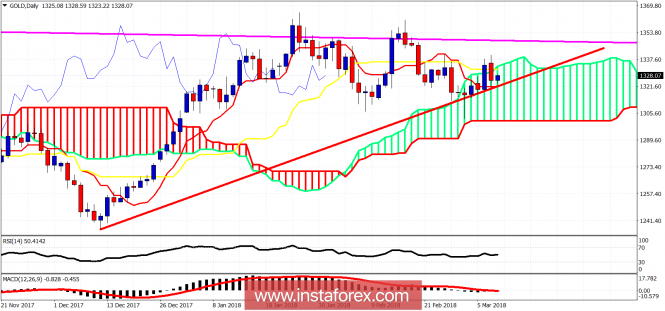
Gold price is trading inside the Kumo in the Daily chart. The low at $1,302 so far is the most important support level and as long as price is above it, I will be expecting the short-term uptrend to continue and eventually break above the double top for new highs. We also find support at $1,320. Break below it and we will test $1,300. Resistance is at $1,340. Break it and most probably we break the double top.

The material has been provided by InstaForex Company - www.instaforex.com