
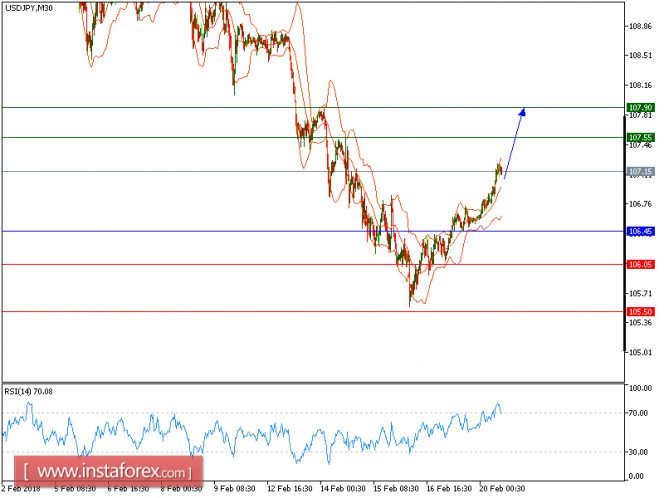
USD/JPY is expected to trade with a bullish outlook. the pair keeps trading on the upside challenging the overhead resistance at 107.55. In fact, it is riding on a rising trend line drawn from the low of last Friday (February 16). It has also shot above the upper Bollinger band, calling for acceleration to the upside.
Therefore, the intraday outlook remains very bullish. Upon crossing 107.55, the pair should target 107.55. The trailing key support has been raised to 107.90.
Alternatively, if the price moves in the opposite direction, a short position is recommended to be below 106.45 with a target of 106.05.
Chart Explanation: The black line shows the pivot point. The current price above the pivot point indicates a bullish position, while the price below the pivot point is a signal for a short position. The red lines show the support levels, and the green line indicates the resistance level. These levels can be used to enter and exit trades.
Strategy: BUY, stop loss at 106.45, take profit at 107.55.
Resistance levels: 107.55, 107.90, and 108.45
Support levels: 106.05, 105.50, and 105.20.
The material has been provided by InstaForex Company - www.instaforex.com