
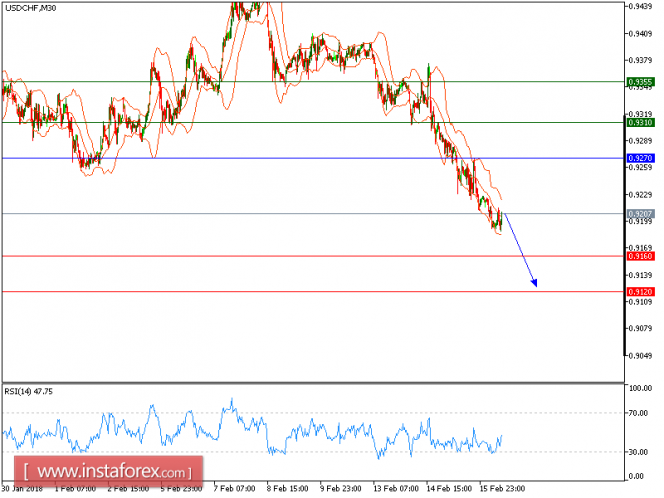
All our downside targets which we predicted in the previous analysis have been hit. USD/CHF is under pressure. The pair recorded a process of lower tops and lower bottoms since February 14, which confirmed a bearish outlook. The downward momentum is further reinforced by both declining 20-period and 50-period moving averages. The relative strength index lacks upward momentum.
Hence, below 0.9270, look for a new decline with targets at 0.9160 and 0.9120 in extension.
Chart Explanation: The black line shows the pivot point. The present price above the pivot point indicates a bullish position, and the price below the pivot point indicates a short position. The red lines show the support levels, and the green line indicates the resistance levels. These levels can be used to enter and exit trades.
Strategy: SELL, stop loss at 0.9270, take profit at 0.9160.
Resistance levels: 0.9310, 0.9355, and 0.9385
Support levels: 0.9160, 0.9120, and 0.9090.
The material has been provided by InstaForex Company - www.instaforex.com