
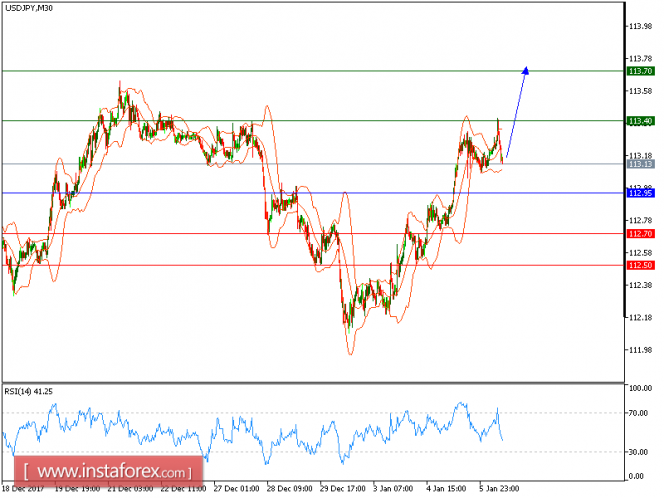
USD/JPY is expected to trade in an upper range. The pair has managed to trade at levels above 113.00 while remaining in a consolidation phase initiated from a high of 113.32 reached last Friday (January 5). Currently, it is near the 20-period moving average and is seeking support from the 50-period one.
As long as the key support at 112.95 (a previous resistance) is not breached, the pair should revisit 113.40 before advancing further to 113.70.
Alternatively, if the price moves in the opposite direction, a short position is recommended below 112.95 with a target of 112.70.
Chart Explanation: The black line shows the pivot point. The current price above the pivot point indicates a bullish position, while the price below the pivot point is a signal for a short position. The red lines show the support levels and the green line indicates the resistance level. These levels can be used to enter and exit trades.
Strategy: buy, stop loss at 112.95, take profit at 113.40.
Resistance levels: 113.40, 113.70, and 114.00
Support levels: 112.70, 112.50, and 112.15.
The material has been provided by InstaForex Company - www.instaforex.com