
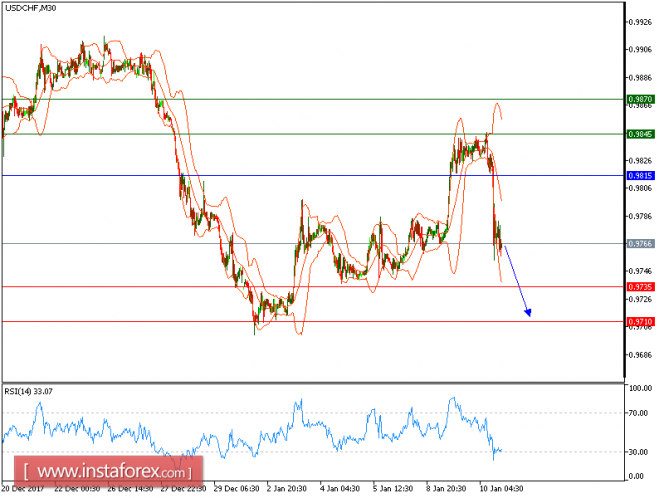
USD/CHF is under pressure. The pair keeps trading on the downside after breaking below a support at 0.9815. Currently, it is at levels around the 20-period moving average, which stands below the 50-period one. A lack of upward momentum is also indicated by the relative strength index staying at levels below the neutrality level of 50. A break below the immediate support at 0.9815 would trigger a further drop toward 0.9735 on the downside.
Chart Explanation: The black line shows the pivot point. The present price above the pivot point indicates a bullish position, and the price below the pivot point indicates a short position. The red lines show the support levels and the green line indicates the resistance levels. These levels can be used to enter and exit trades.
Strategy: Sell, stop loss at 0.9815, take profit at 0.9735.
Resistance levels: 0.9840, 0.9870, and 0.9915
Support levels: 0.9735, 0.9710, and 0.9665.
The material has been provided by InstaForex Company - www.instaforex.com