
Technical outlook:
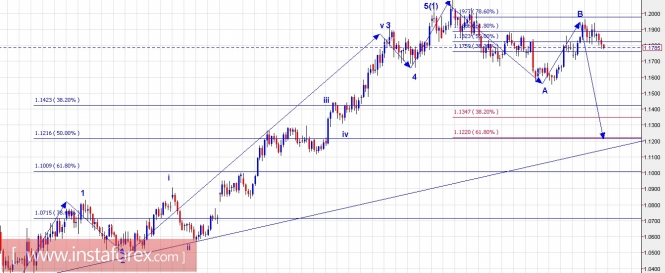
The daily chart setup has been presented with the most probable wave count for a medium-term outlook in EUR/USD. A simple wave count describes that the pair might have already completed its 5 wave advance in 2017 from 1.0350 through 1.2092 levels respectively. The same has been labelled as wave (1) here. Furthermore, the drop through 1.1550 levels could be labelled as wave A and the rally thereafter as wave B, within the A-B-C corrective drop. Wave C could possibly drop all the way through 1.12 or 1.14 levels which are fibonacci 0.50 and 0.382 supports respectively. If this wave count holds to be true, then EURUSD should remain below 1.1960 and subsequently below 1.2092 levels as well. As an alternative, if the pair is seen to be bouncing off 1.1680/1.1700 levels, we shall take a review and decide further action.
Trading plan:
Remain short for now with risk above 1.1960 and minimum target 1.1680/1.1700.
US Dollar Index chart setups:
Technical outlook:
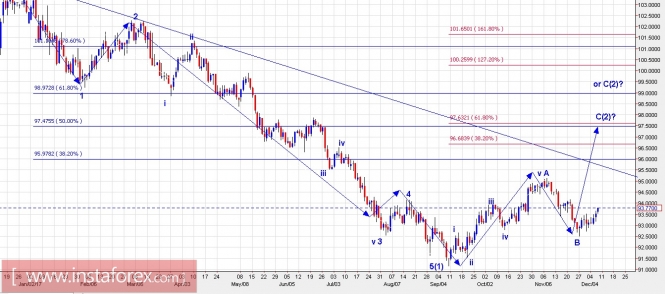
The US Dollar Index daily chart setups has been presented here for a long-term view. The index seems to have dropped 5 waves lower from 103.80 levels through 91.00 levels since early 2017, labelled as wave (1) here. Furthermore the subsequent rally towards 95.10 levels can be defined as wave A, and the drop towards 92.50 can be defined as wave B respectively. Wave C is then expected to terminate around 97.50 levels as depicted here, or it could push towards 98.00 levels, labelled as wave (2) here. If this wave count holds true, then prices should remain above 92.50 levels going forward. As an alternate count, a bearish reversal from around 94.10/20 levels could change the short term outlook.
Trading plan:
Remain long with risk below 92.50 targeting 94.10/20 levels at least.
Fundamental outlook:
Please watch out for Mr Draghi's conference in about 3 hours from now
Good luck!
The material has been provided by InstaForex Company - www.instaforex.com