
Technical outlook:
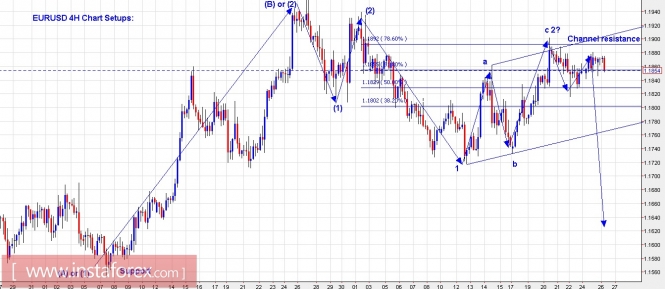
The EURUSD chart is telling the same story as we have been discussing since last few trading sessions. All through the remaining trading sessions for December 2017, the pair might trade sideways within the above channel formed with lack of participation, but once volumes return one should expect a break below channel support and witness a drop towards 1.1550 at least. The wave structure also remains unchanged with the 3rd of (3)rd wave expected to resume lower. Please note that line in sand remains at 1.1960 levels and prices should not exceed that if the bears are to stay in control. The pair has also tested Fibonacci 0.786 resistance levels around 1.1900 last week and it could retest before finally giving in to bears again. We suggest that you exercise more patience through the next few days and keep the bigger picture in mind.
Trading plan:
Please remain short for now, stop above 1.1960, target below 1.1550 levels.
US Dollar Index chart setups:
Technical outlook:
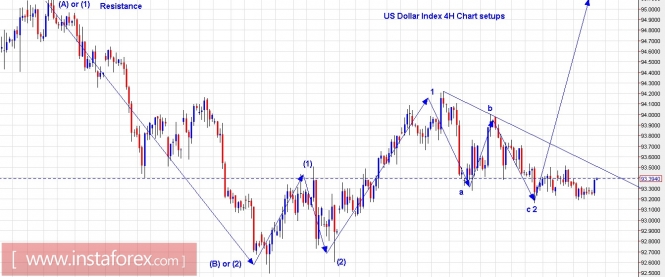
The US Dollar Index is looking to break above its immediate line of resistance as highlighted here. A push above 93.50 levels would confirm that prices are again into the buy zone and also the corrective phase is over with a meaningful low in place through 93.15 levels. The overall wave structure also remain intact with the 3rd of (3)rd wave expected to resume any moment, maybe due to lack of volumes for the next few days it might delay the process. For this structure to remain intact, prices need to stay above 92.50 levels going forward and if it does, we should be seeing 95.00 and 98.00 levels very soon. Please note that on the bigger picture, at least an (A)-(B)-(C) corrective rally is unfolding for now, with wave (C) into progression.
Trading plan:
Please remain long for now, stop below 92.50, target 95.00 and higher.
Fundamental outlook:
No major events are lined up for the day.
Good luck!
The material has been provided by InstaForex Company - www.instaforex.com