
Technical outlook:
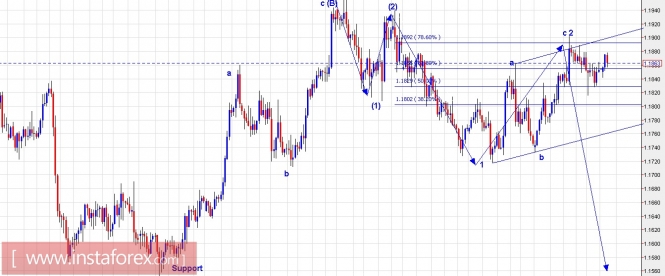
The EUR/USD pair continues to drift within a tight trading range after hitting 1.1900 levels last week. At this point in time, it is producing an engulfing bearish candlestick pattern indicating a potential bearish drop. The rally from 1.1720 levels was also corrective in nature a-b-c which got complete at 1.1900 levels. A channel drawn across the boundary also suggests that correction is over and bearish move should continue. To simplify, till price remain below 1.1960 levels, the EURUSD pair should be looking to push lower. The wave structure also suggests that the pair might have formed a meaningful top in place at 1.2092 levels and should be looking to drop much lower below 1.1550 levels going forward.
Trading plan:
Please remain short for now, stop above 1.1960 and target 1.1550 levels at least.
Starting today, we shall be posting Complementary Trade Setup and Educational Videos here. You are encouraged to take this as an opportunity to enhance trading skills. Please click the below links to open.
Educational video:
Trade Setups: December 22-25, 2017
US Dollar Index chart outlook:
Technical outlook:
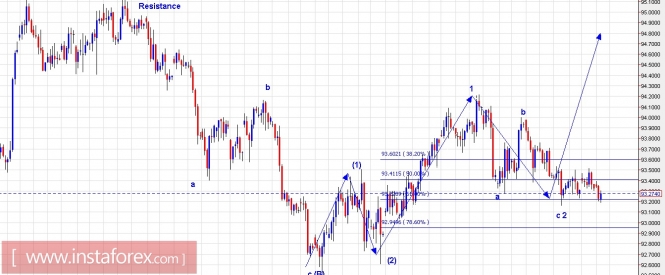
The US Dollar index is working out a potential bottom around 93.00/10 levels for now. Its wave structure still remains constructive for bulls and a rally through 95.00 and higher levels still remain very much on cards. Please note that price is taking support at fibonacci 0.618 levels and a bullish reversal here should be high probability till it stays above 92.50 levels respectively. The overall wave structure also indicates that the US Dollar Index has produced an impulse (5 waves) from 91.00 levels through 95.00 levels earlier, followed by a corrective drop towards 92.50 levels. It remains high probable for the index to continue rallying and unfold into 5 waves at least going forward.
Trading plan:
Please remain long for now, stop below 92.50, target 95.00 and 98.00.
Fundamental outlook:
There are no major fundamental events lined up for the day.
Good luck!
Merry Christmas and A Blessed Year Ahead!
The material has been provided by InstaForex Company - www.instaforex.com