
Technical outlook:
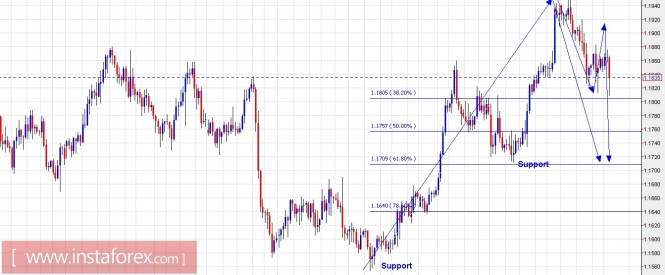
A short-term trade setup has been presented here for EUR/USD on a 4H time frame. The wave structure suggests that EUR/USD might have hit an interim resistance around 1.1950/60 levels earlier and it should be looking to drop lower at least towards 1.1700 levels going forward. As discussed yesterday, the pair has found interim support around 1.1800 levels and is looking to bounce towards 1.1900 for now and then reverse lower towards 1.1700 levels respectively. For this wave count to hold true, prices should remain below 1.1960 levels from here on. We shall be taking a short-term view for the pair at least till a meaningful top or bottom is formed. Resistance is at 1.1960 levels while support is seen through 1.1700 levels respectively. Besides, the fibonacci 0.618 support is seen to be passing through 1.1700 levels and a bullish bounce could be a possibility then.
Trading plan:
Please look to sell around 1.1900 levels with risk above 1.1970 and target 1.1700.
US Dollar Index chart setups:
Technical outlook:
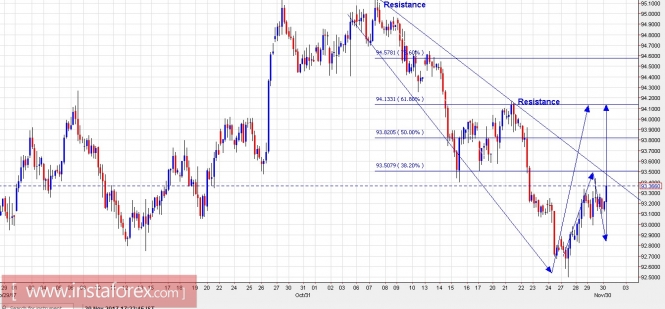
The short-term outlook for the US Dollar Index suggests that the instrument may drop lower towards 92.90 levels before picking up again towards 94.20/30 levels. Please note that resistance is strong at 94.20 since fibonacci 0.618 levels and the previous price resistance converges there. We would still recommend to remain flat at least for now and the look to go long again at lower levels. A short-term resistance trend line is also being tested and a slight correction looks to be due. Going forward, the break of that trend line would encourage bulls to target 94.20 levels at least. Please note that we are trying to remain conservative and still giving enough room for the probability above 95.00 levels going forward. It is always better to take a short-term approach for the next few trading sessions until meaningful highs and lows are formed to be held going forward.
Trading plan:
Please look to go long again around 92.90/93.00 levels stop below 92.50 and target 94.20
Fundamental outlook:
Please watch out for USD PCE Core today around 08:30 AM EST.
Good luck!
The material has been provided by InstaForex Company - www.instaforex.com