
The pair is doing a consolidation above the 200 SMA and it's testing the upper Bollinger band across the board. Next target to the upside is placed at the 1.3309 level, at which we can expect further selling pressure in order to re-test the 200 SMA at H1 chart. If that resistance gives up, the next hurdle to overcome lies at 1.3360.
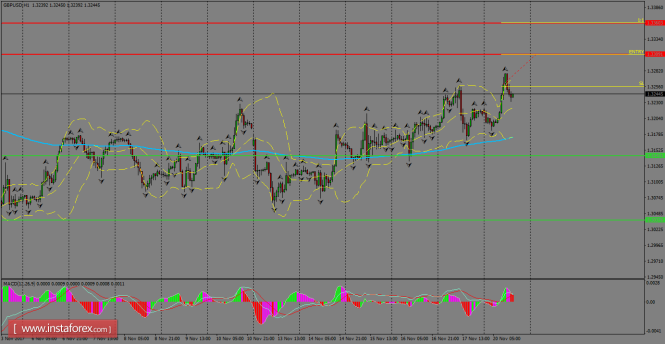
H1 chart's resistance levels: 1.3309 / 1.3360
H1 chart's support levels: 1.3143 / 1.3037
Trading recommendations for today: Based on the H1 chart, buy (long) orders only if the GBP/USD pair breaks a bullish candlestick; the resistance level is at 1.3309, take profit is at 1.3360 and stop loss is at 1.3256.
The material has been provided by InstaForex Company - www.instaforex.com