
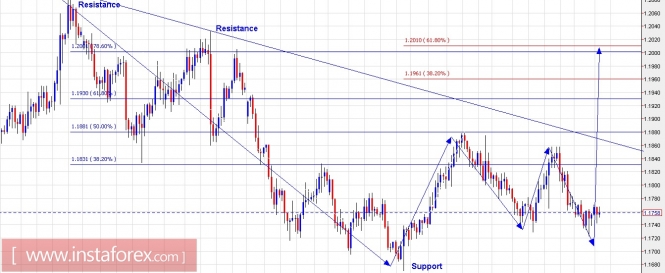
Technical outlook:
The EUR/USD pair is seen to be unchanged from what was discussed yesterday. The pair has managed to hold intraday gains until now after printing lows at 1.1723 levels and it looks like it has completed minimum requirements for a corrective drop from 1.1880, in 3 waves now. Either a flat or a triangle still remains a possibility for this consolidation termination point. If the above count holds to be true, prices should remain above 1.1670 levels and push through 1.1950 and 1.2000 levels in the coming sessions. It could be in the process of forming a down gartley around 1.2000 levels, before dropping lower again. On the flip side, a drop below 1.1670 levels would indicate further drop and also that a meaningful top is in place at 1.1880 levels. We shall be looking to change the plan then.
Trading plan:
Aggressive traders, please remain long with risk below 1.1670 levels targeting 1.1950/1.2000 while conservative traders might want to sell higher.
US Dollar Index chart setups:
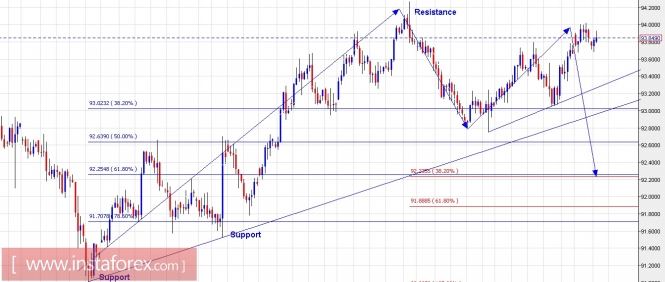
Technical outlook:
The US Dollar Index also remains mostly unchanged for now since we presented yesterday. A high probable trade setup in the short term should be lower from here, forming an up Gartley towards 92.00/20 levels, before beginning to push higher again. If this wave count holds to be true, prices would ideally stay below 94.30 levels and push lower towards Fibonacci convergence seen at 94.25 levels, as presented here. On the flip side though, a push higher, through 94.25 levels would confirm that a meaningful low is formed at 92.80 levels and bulls would want to remain in control going forward. Immediate resistance is seen at 94.20/30 levels, while support is at 91.80 levels respectively. A break below 93.00 levels from here, confirms that downside remains intact.
Trading plan:
Aggressive traders would want to remain short with risk above 94.30 levels targeting 92.00/25, while conservative traders would want to buy lower around 92.20 levels.
Fundamental outlook:
No major event is lined up for the rest of the day.
Good luck!
The material has been provided by InstaForex Company - www.instaforex.com