
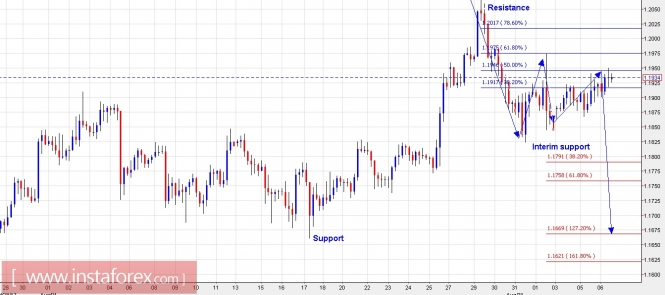
Technical outlook:
The EUR/USD 4H chart has been presented here with a simple wave structure and fibonacci ratios to highlight next probable move. The pair has produced a down leg as seen here between 1.2070 and 1.1820 levels last week, shown as blue arrow/s. Furthermore, the pair has retraced upto 61.8 percent of an earlier drop to 1.1980 levels and is most probably into its 3rd of 3rd wave now. Ideally, EUR/USD should remain below 1.2070 levels, to keep the above wave count/structure intact, and should resume lower towards 1.1750 and 1.1600 levels more quickly than expected. Interim support is seen at 1.1820 levels while strong resistance should be seen at 1.2070 levels as depicted above. There is no change in the trade direction suggested earlier, and it is a safe strategy to remain short on intraday rallies. The pair is seen to be trading around 1.1930/40 levels at this moment, an ideal place to add short positions. In the next 7 trading sessions, the pair is expected to drop through 1.1600 levels.
Trading plan:
Please continue holding short positions and also look to add now, stop above 1.2070 levels, target 1.1600.
GBPUSD chart setups:
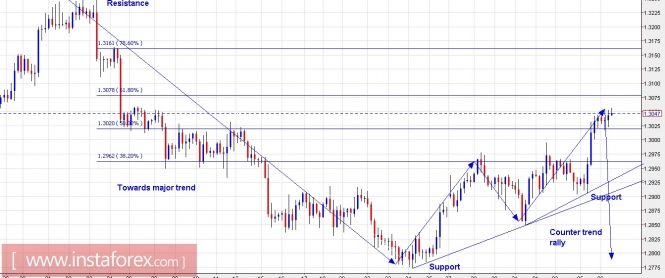
Technical outlook:
The GBP/USD story continues to carve out exactly as a book example of the wave principle and it can be easily rated as the chart of the month. Let us simply understand the wave structure presented on 4H chart view here. The entire drop between 1.3267 and 1.2770 levels is towards major trend which is down (produced as an impulse). Furthermore, the pair has produce a 3-wave counter trend rally where waves A and C are absolutely in sync and equal in pip counts (205 pips approx). Besides, note that it is trading very close to fibonacci 0.618 resistance as well which is expected to provide the required push lower. Finally, the pair looks to be ready for the much awaited wave 3 lower towards 1.2600 and 1.2300 levels at least. Major resistance is now seen through 1.3267 levels, while support is at 1.2900 levels. A safe strategy is to add short positions now and discussed earlier.
Trading plan:
Please remain short and look to add further around 1.3050 levels, stop at 1.3270 and target 1.2600 and lower. This is a slightly long-term trade plan which we have followed since beginning of August 2017.
Fundamental events:
Please watch out for USD ISM Manufacturing data to be out today at 10:00 AM EST.
Good luck!
The material has been provided by InstaForex Company - www.instaforex.com