
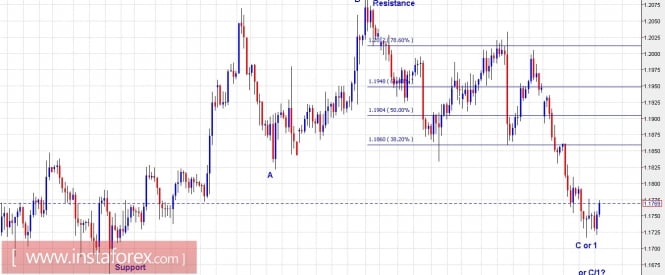
Technical outlook:
The wave structure presented above is indicating that EUR/USD maybe topped out at 1.2092 levels and the triangle structure discussed earlier is no longer valid since prices have already broken below 1.1820 levels this week. There is greater possibility of wave 1 terminating at 1.1675 or it has already terminated at 1.1716 levels yesterday as labelled here. This leaves us with a clear option to sell on rallies through 1.1900/50 levels which is also fibonacci 0.618 resistance of the entire drop from 1.2092 through 1.1716 levels respectively. Bulls are not yet able to produce the counter trend rally required but selling on rallies should be a simple trade strategy going forward. Please note that immediate support is seen at 1.1675 levels while a meaningful resistance is at 1.2092 levels respectively.
Trading plan:
Please look to sell higher through 1.1900/50 levels, stop above 1.2092 and target is lower towards 1.1500 levels at least.
GBP/USD chart setups:
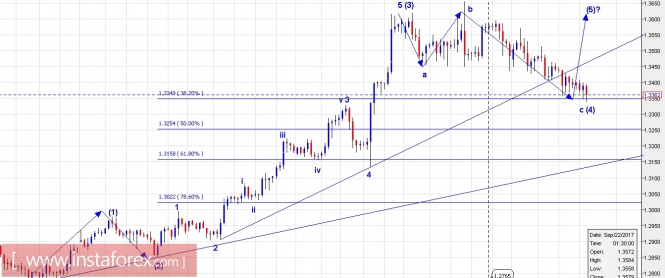
Technical outlook:
The wave structure presented here is that of the last 5 waves of potential wave C of a higher degree which would terminate into wave (4) of one higher degree before pushing lower towards the larger trend. As one can note, GBP/USD has carved out waves (1) through (4) as labelled here and might be preparing for a wave (5) push higher towards 1.3650/1.3700 levels before terminating into the higher degree wave (4) and reversing lower again. Besides, please note that the current wave (4) is terminating around the fibonacci 0.382 support of wave (3), a common guideline. Furthermore, the pair is producing a tweezer bottom candlestick pattern around 1.3340/70 levels, indicating a potential bullish reversal. On the other hand, if we presume that a top is in place at 1.3655 levels last week, then the pair should at least rally towards 1.3550 levels which is fibonacci resistance of the drop between 1.3655 through 1.3341 levels respectively.
Trading plan:
Aggressive: Remain long with stop below todays low targeting 1.3550
Conservative: Look to sell higher around 1.3550/1.3600 levels, stop 1.3700 and higher target lower towards 1.2000
Fundamental outlook:
Watch out for German Consumer Price Index and USD GDP figures today between 08:00 and 08:30 AM EST for price volatility.
Good luck!
The material has been provided by InstaForex Company - www.instaforex.com