
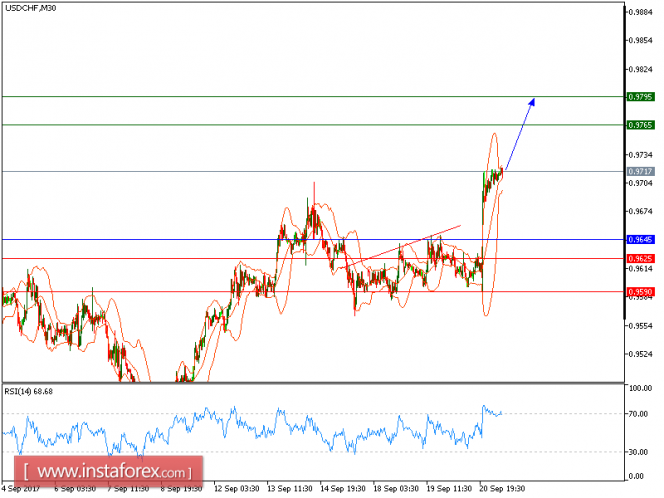
All our targets which we predicted in yesterday's analysis have been reached. The pair is trading above its ascending 20-period and 50-period moving averages, which play support roles and maintain the bullish bias. The relative strength index is calling for a new upleg. The downside potential should be limited by the key support at 0.9645.
As widely expected, the Federal Reserve kept its key interest rates unchanged. It also announced plans to begin in October shrinking its approximately $4.2 trillion in holdings of U.S. Treasury bonds and mortgage-backed securities acquired after the 2008 financial crisis. However, according to projections released at the same time by the Federal Open Market Committee, the central bank will go ahead for one more rate increase this year and three times next year. This blew a surprise to the market, as investors had previously believed a series of weak inflation readings might alter the Fed's monetary tightening plans.
To sum up, as long as this key level is not broken, look for a further advance to 0.9765 and even to 0.9795 in extension.
Chart Explanation: The black line shows the pivot point. The present price above the pivot point indicates a bullish position, and the price below the pivot points indicates a short position. The red lines show the support levels and the green line indicates the resistance levels. These levels can be used to enter and exit trades.
Strategy: BUY, Stop Loss: 0.9645, Take Profit: 0.9765
Resistance levels: 0.9765, 0.9795, and 0.98830
Support levels: 0.9625, 0.9590, and 0.9550
The material has been provided by InstaForex Company - www.instaforex.com