
Overview
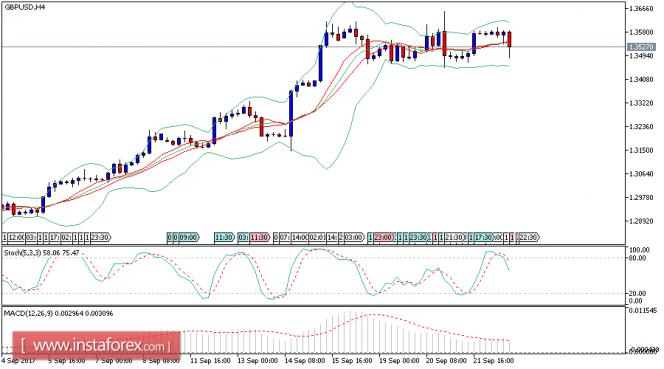
The GBP/USD pair bounced bullishly after approaching from 23.6% Fibonacci correction level for the third time, to reach the thresholds of the recently recorded top at 1.3618. This hints that the price is going to stop the bearish correction and return to the main bullish trend again, especially as the EMA50 continues to support the price from below. By taking a deeper look at the chart, we find that the recent trades are confined inside the bullish flag pattern that appears on the chart. It means that breaching 1.3595 will provide momentum that will push the price to resume the main bullish trend in the short term. Therefore, these factors encourage traders to suggest the bullish trend on the intraday and short-term basis with its next main target located at 1.3680. Please note that breaching this level will extend the pair's gains to reach 1.3834, while the expected rise will remain valid unless breaking 1.3418 level and holding below it. The expected trading range for today is between 1.3500 support and 1.3680 resistance.
The material has been provided by InstaForex Company - www.instaforex.com