
Technical outlook:
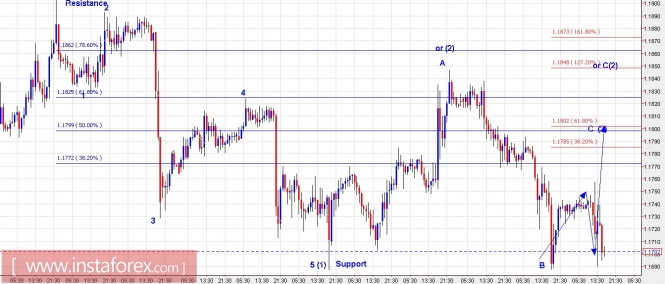
The EUR/USD hourly chart setup has been presented here for an alternate view in continuation to what was discussed yesterday. The pair failed to print fresh lows, instead, it is setting up for a complex corrective wave structure as labeled here. Going forward if EUR/USD does not break below 1.1687 levels, we should expect a rally towards at least 1.1800 or towards 1.1850 levels as seen in Red Color here. The termination point of the wave (1) is clear at 1.1687 levels but that of the wave (2) could be either at 1.1800 or 1.1850 levels, depending on the structure of correction. A safe way to trade the above pair would be to sell on rallies from here. Immediate support is seen at 1.1687 levels, while resistance is strong at 1.1910 levels respectively. It is more probable for EURUSD to form a lower top near 1.1800 levels before reversing lower again.
Trading plan:
Please remain long with a stop below 1.1687, targeting 1.1800 and then reverse with a stop above 1.1910.
GBP/USD chart setups:
Technical outlook:
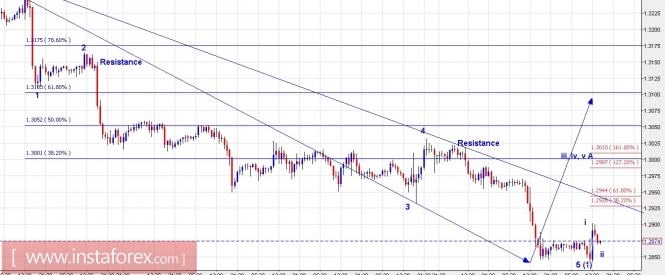
The GBP/USD short term structure has been presented here with probable wave counts. Please note that now with yet another low printed today at 1.2837 levels, the impulsive drop from 1.3267 levels looks to be complete. Furthermore, the pair has produced a 60/70 pip impulsive rally as well, which could be the first leg up at a small degree. This also indicates that the much-awaited counter trend rally might have finally triggered. Please note that if the above wave count holds well, a three wave counter trend rally A-B-C is expected to complete through 1.3010/20 and subsequently 1.3100 levels as seen here. Also note that 1.3100 levels are the Fibonacci 0.618 resistance as well, of the entire drop between 1.3267 and 1.2837 levels respectively. Immediate support is seen at 1.2837 levels, while resistance is at 1.3020 levels respectively.
Trading plan:
Long now from 1.2860/70 levels, stop below 1.2837, target 1.3020 and 1.3100
Fundamental outlook:
Watch out for FOMC Minutes today at 0200 PM EST.
Good luck!
The material has been provided by InstaForex Company - www.instaforex.com