
The pair continues to ride a bearish bias below the 200 SMA (H1 chart) and the focus is now placed around 1.2761, as the next key support. If Cable manages to break below that zone, declines are expected to take place towards 1.2647 in a first degree. That's our preferred scenario so far, but with a break above 1.2843, one could expect a continuation to test the 200 SMA once again.
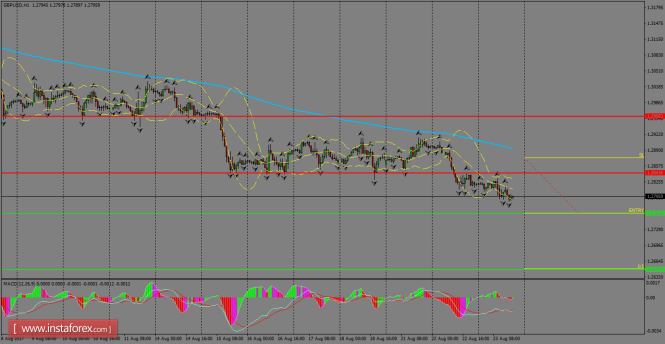
H1 chart's resistance levels: 1.2843 / 1.2958
H1 chart's support levels: 1.2761 / 1.2647
Trading recommendations for today: Based on the H1 chart, sell (short) orders only if the GBP/USD pair breaks a bearish candlestick; the support level is at 1.2761, take profit is at 1.2647 and stop loss is at 1.2873.
The material has been provided by InstaForex Company - www.instaforex.com