
GBP/USD may a have an interesting week given that it has been trading in sideways between 1.3021 and 1.2955 levels across the board. A breakout below 1.2955 level should expose pair to move towards the next key area of 1.2897. The downside risk remains alive as the pair continues to trade below the 200 SMA on the H1 chart. MACD indicator is still at the positive territory, favoring for more upside.
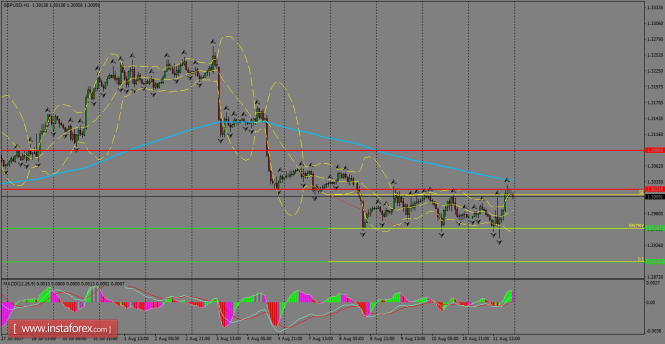
H1 chart's resistance levels: 1.3021 / 1.3080
H1 chart's support levels: 1.2955 / 1.2897
Trading recommendations for today: Based on the H1 chart, place sell (short) orders only if the GBP/USD pair breaks a bearish candlestick; the support level is at 1.2955, take profit is at 1.2867 and stop loss is at 1.3011.
The material has been provided by InstaForex Company - www.instaforex.com