
The Gold price as we expected has broken out of the bearish short-term channel. The trend has reversed to bullish and my minimum expected target is at $1,260 this week. There we could see a pull back but overall I believe a larger degree move higher has started.
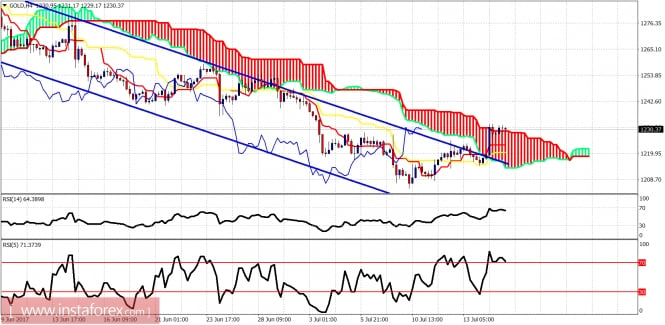
The Gold price has broken out of the bearish channel and is trading above the Ichimoku cloud. The trend is bullish. Short-term support is at $1,215. Resistance is at $1,260. I expect Gold to reach $1,250-60 these weeks.
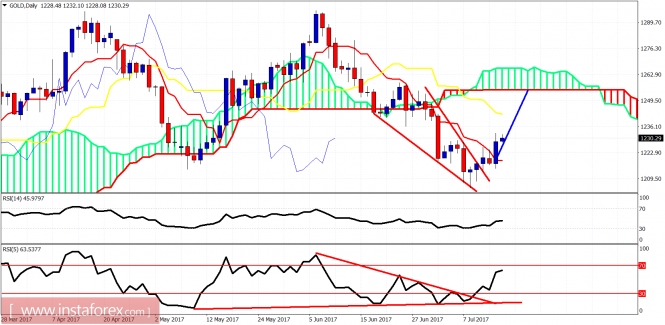
The Gold price has broken the wedge pattern upwards and the minimum target is the daily Kumo (cloud) level at $1,250-60. Breaking the wedge was timely notified by our analysis combined with the warning signs of the oversold conditions of the RSI (5).
The material has been provided by InstaForex Company - www.instaforex.com