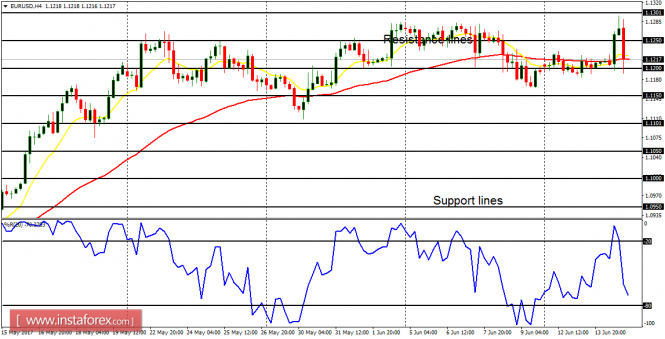
EUR/USD: The EUR/USD pair is neutral in the long term and bearish in the short term. The EMA 11 has crossed the EMA 56 to the downside, and the Williams' % Range period 20 is in the oversold region. This show a possibility of further short-selling in the market, which would ultimately put an end to the current neutral bias.
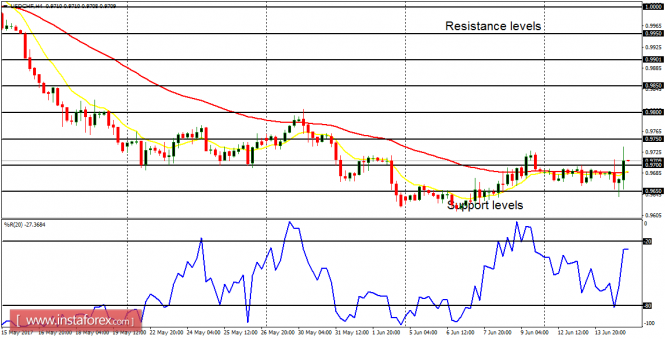
USD/CHF: The USD/CHF pair is neutral in the long term and bullish in the short term. The EMA 11 has crossed the EMA 56 to the upside, and the Williams' % Range period 20 is in the overbought region. This shows a possibility of a further bullish effort in the market, which would ultimately put an end to the current neutral bias.
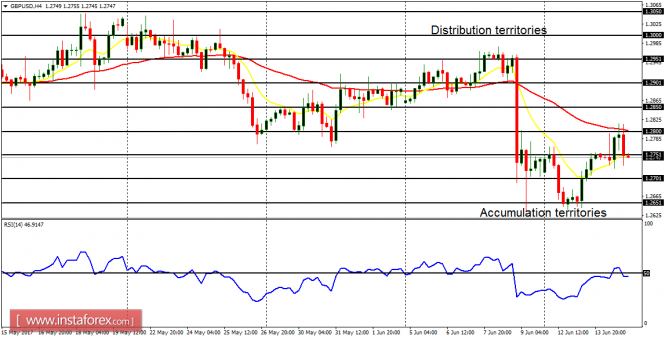
GBP/USD: There is essentially a bearish signal on GBP/USD as price traded lower yesterday. Price is currently below the distribution territory at 1.2700, going towards the accumulation territory at 1.2650. Any rallies here would be transient and eventually lead to further southwards movements.
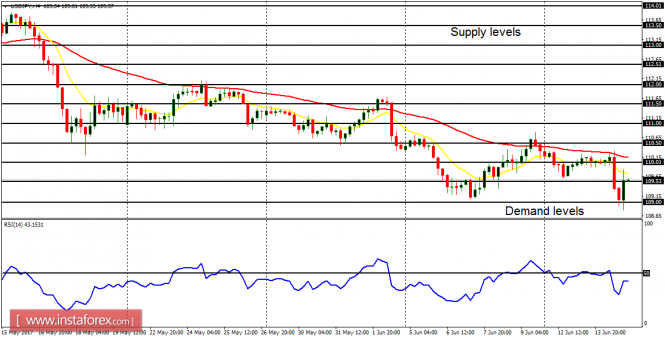
USD/JPY: Although this currency trading instrument has remained rather quiet till now, there is a possibility of a breakout in the market, which would most probably favor bears. The outlook on the JPY pairs is bearish for this week, so price is expected to go more and more bearish when volatility returns to the market.
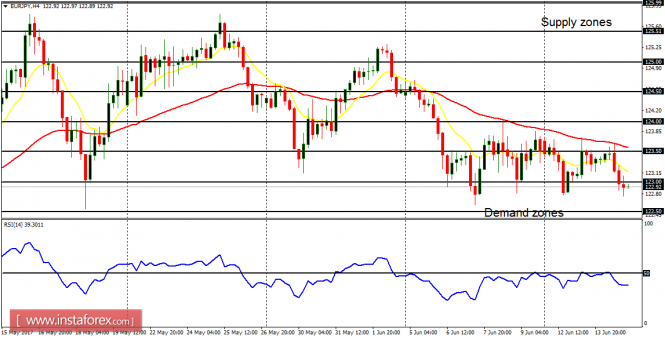
EUR/JPY: There is a Bearish Confirmation Pattern in the EUR/JPY 4-hour chart, as price is currently testing the demand zone at 122.50, which is expected to be breached to the downside very soon. Should this become possible, price would move further downwards to another demand zone at 122.00.